Work
Here is a selection of our projects done with different
clients over the years.
Click the thumbnail
to view and explore a project in detail. →
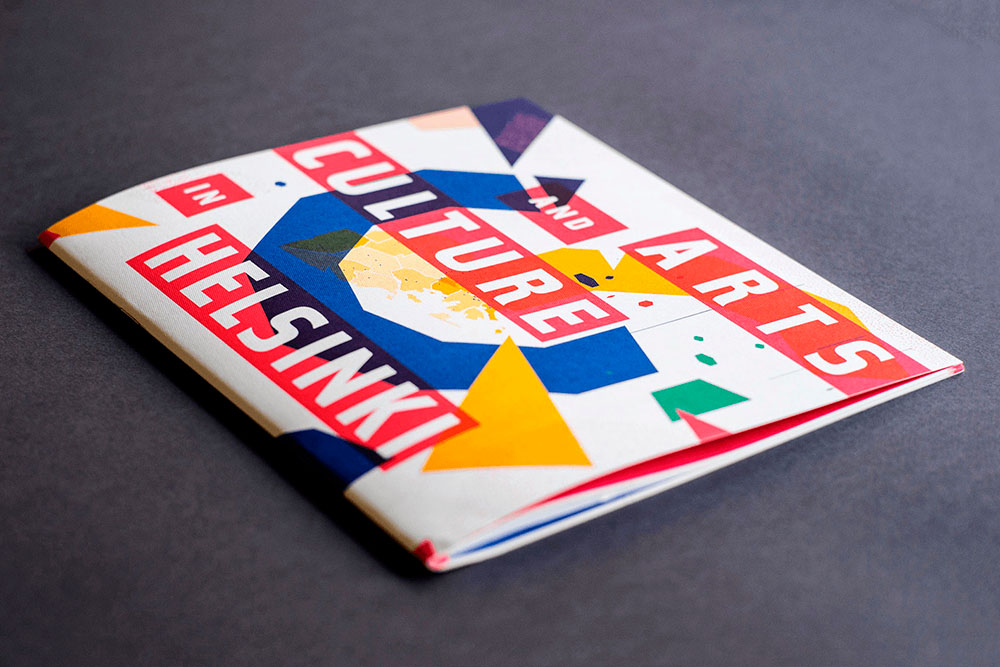
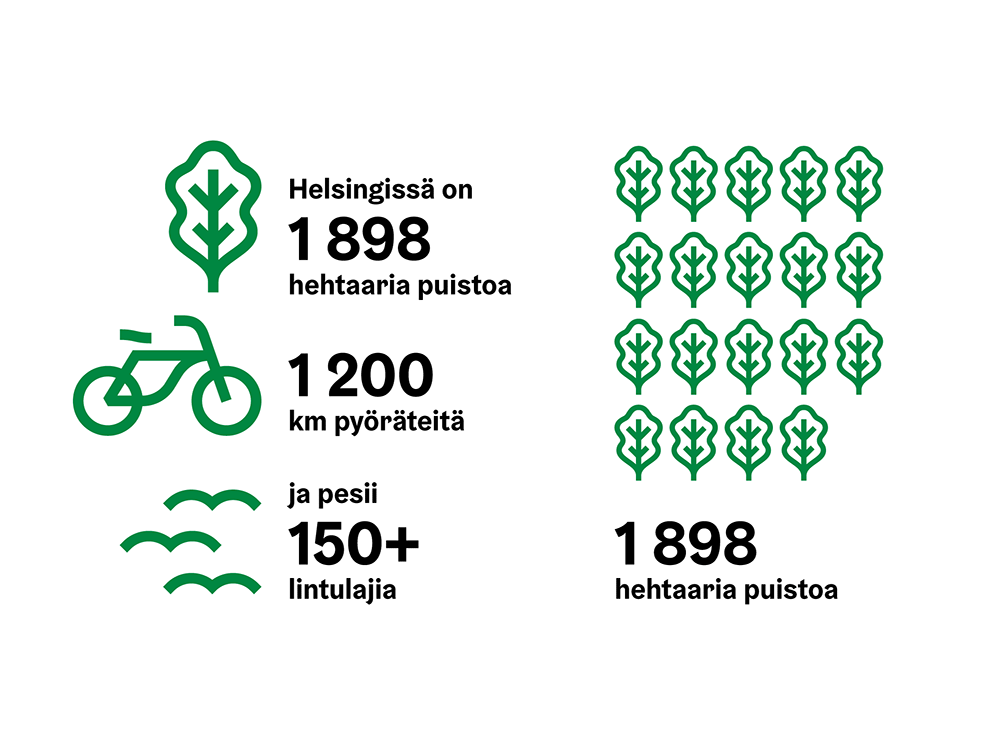
Arts and Culture in Helsinki
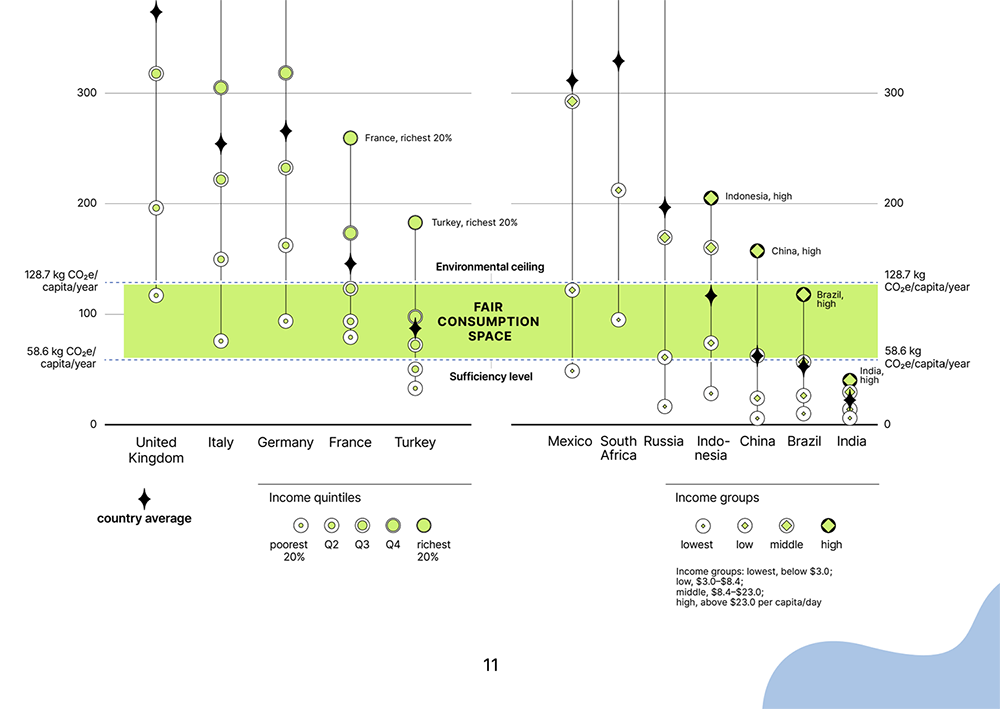
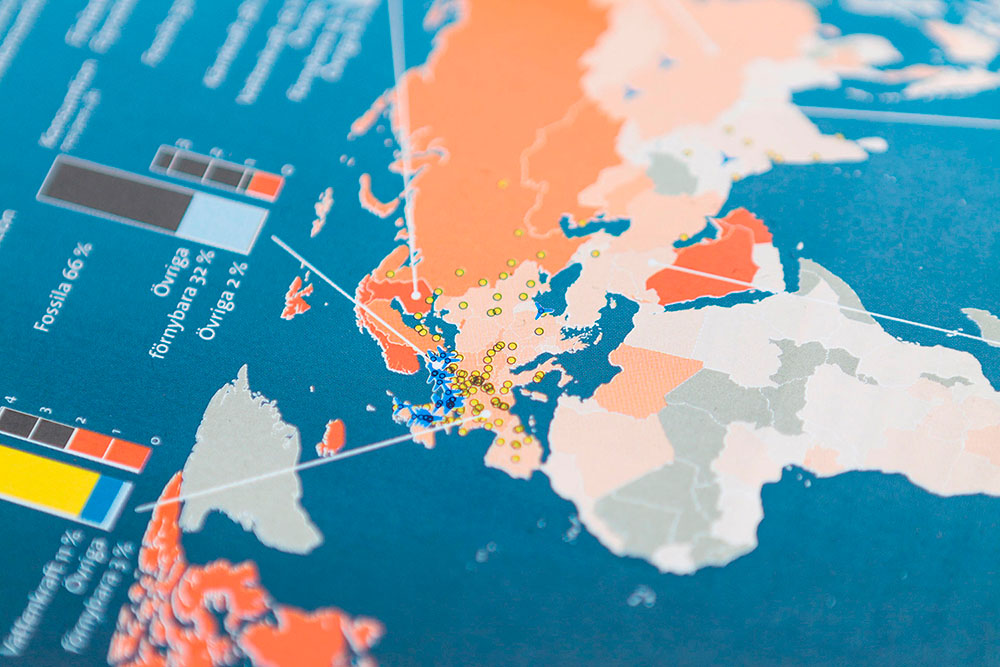
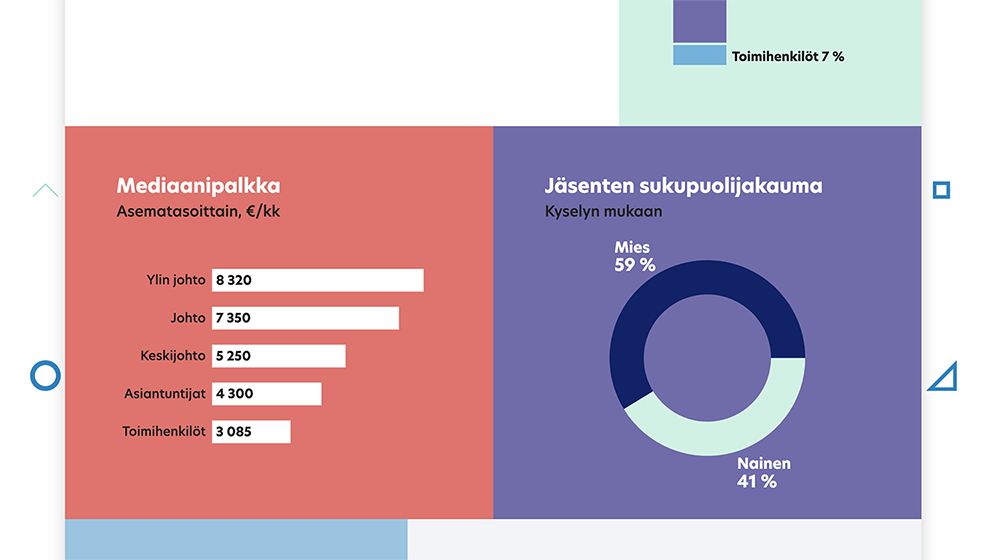
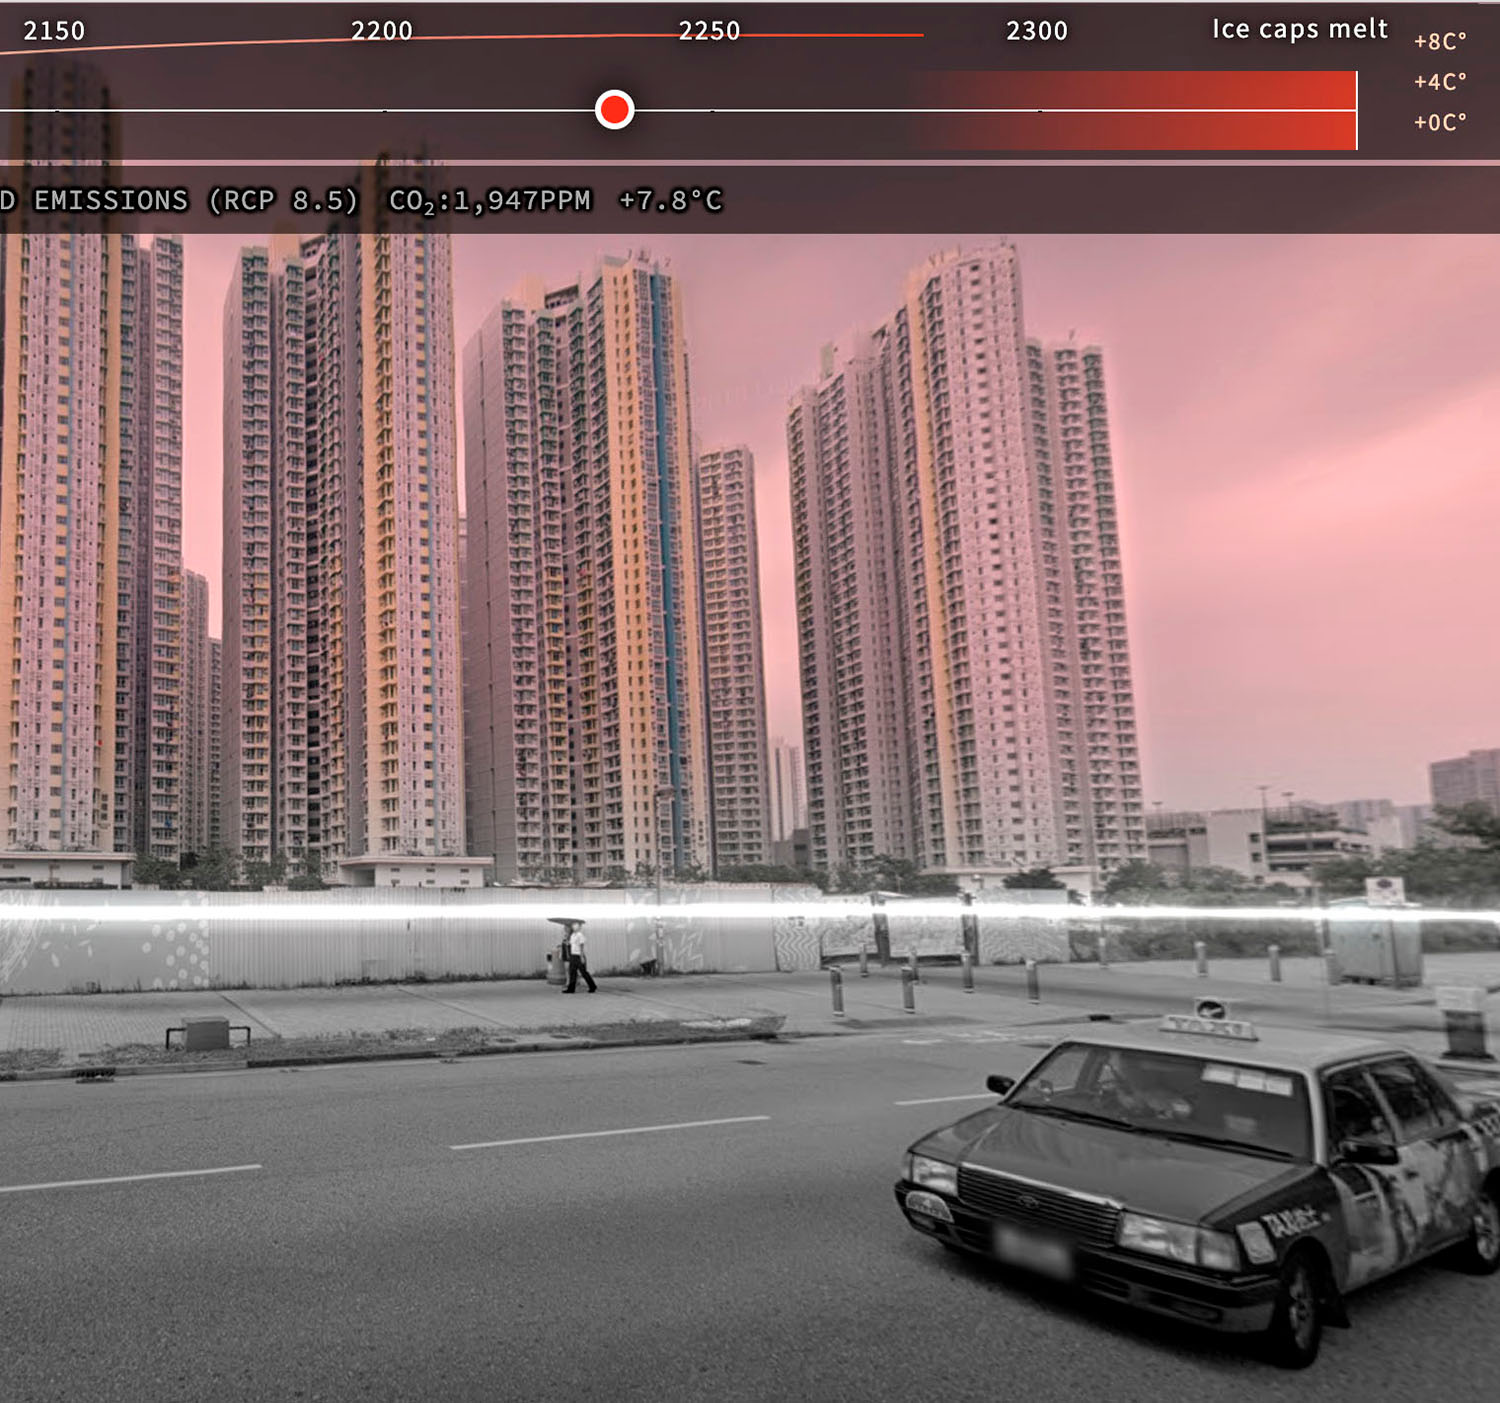
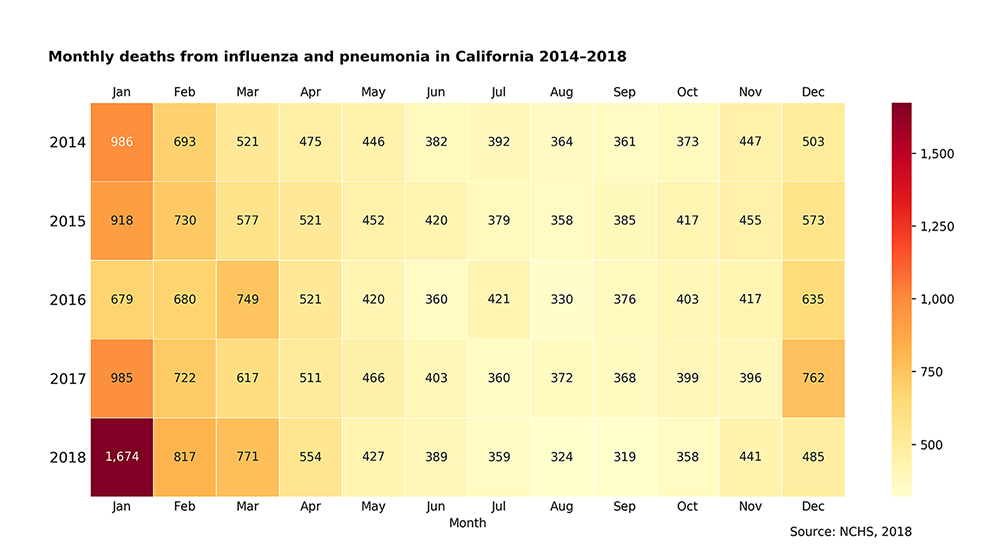
Selected infographics
Manner geography textbooks
YTN Data
Coastline Paradox
City of Helsinki infographics guidelines
SAGE Datasets
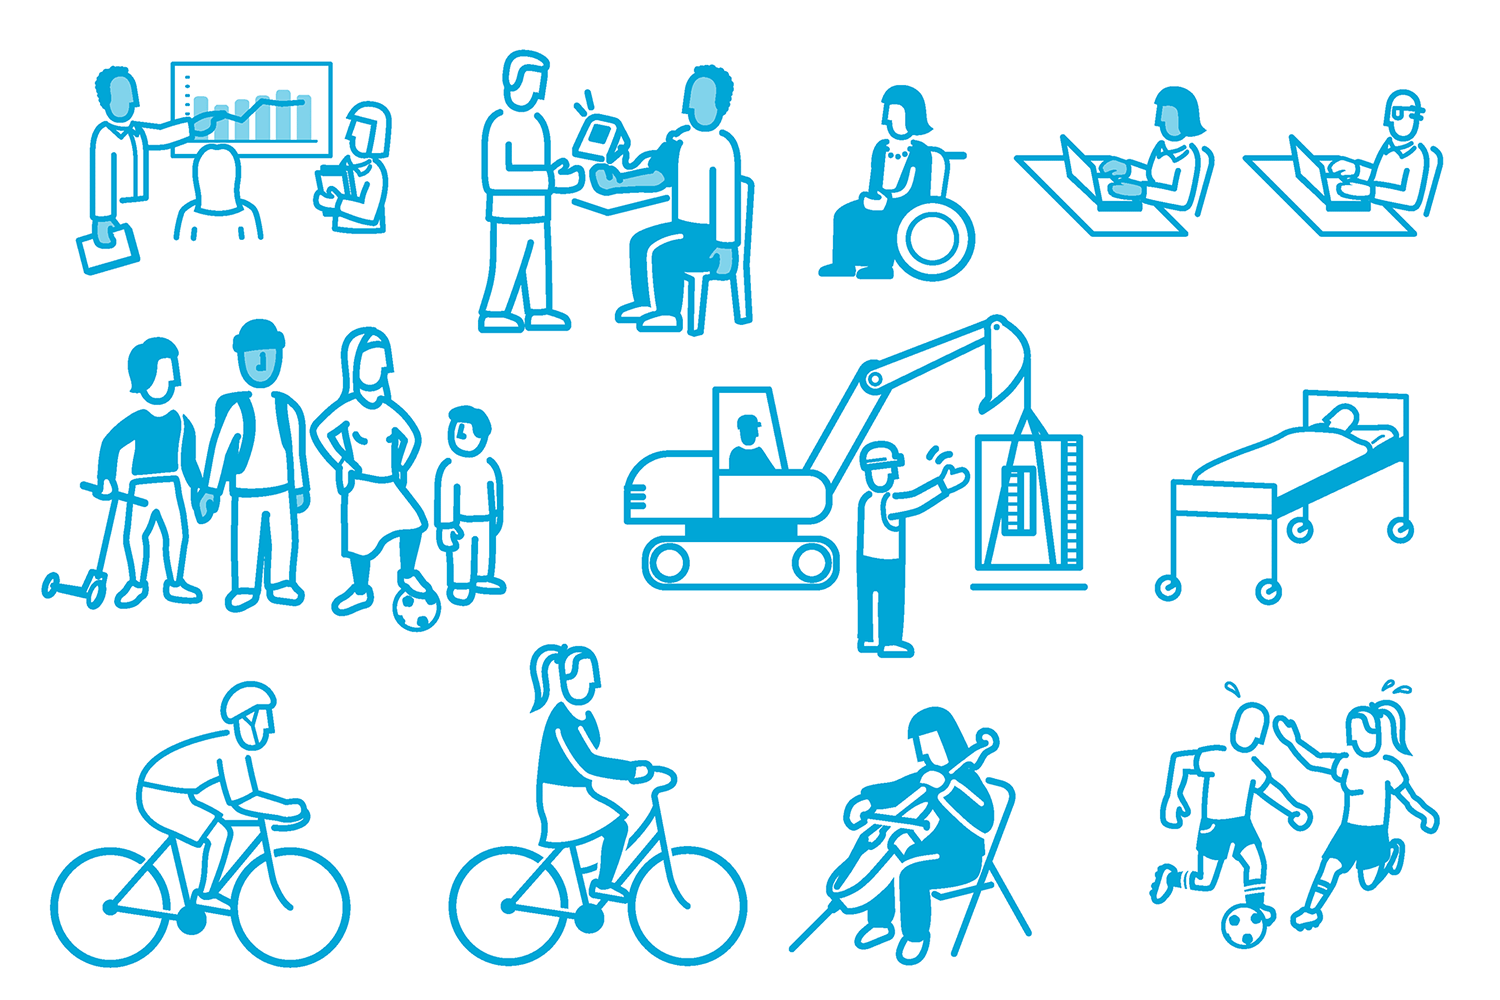
Pictograms for Kuntaliitto
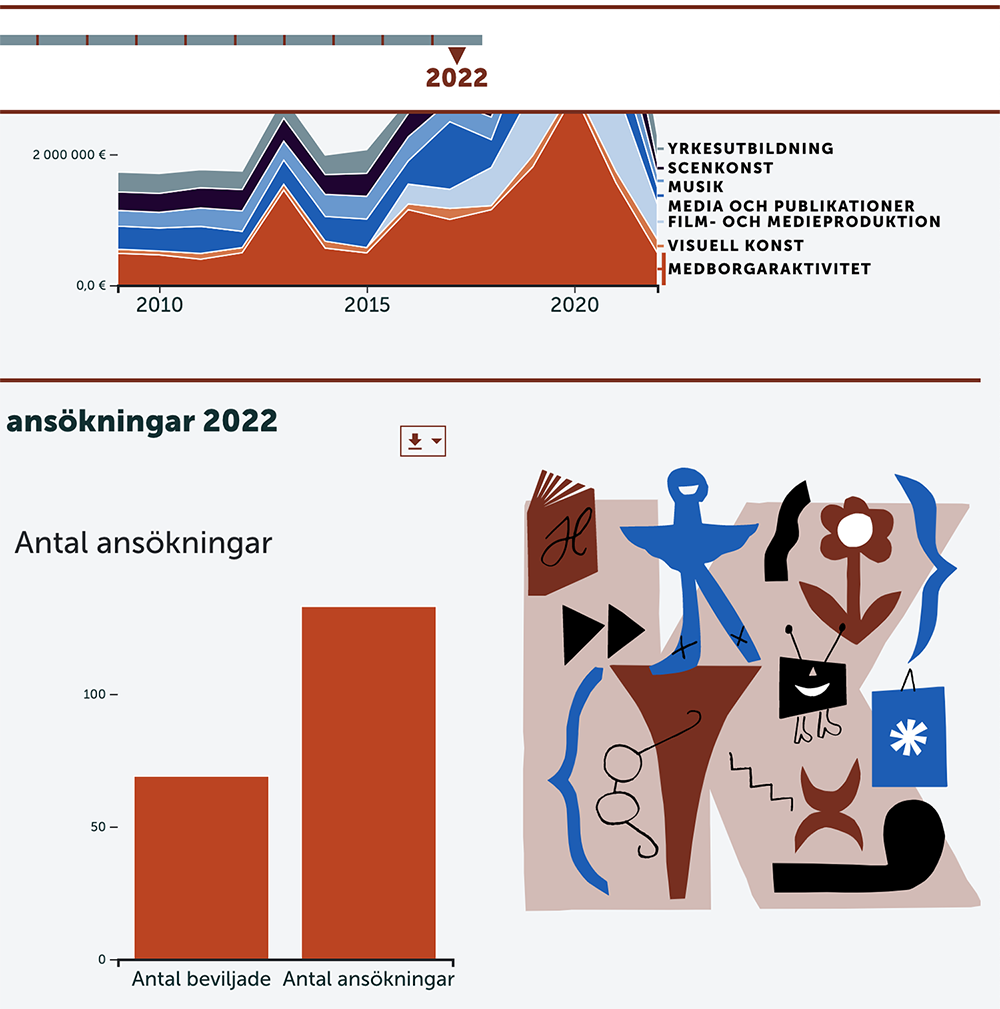
Konstsamfundet grant dashboard
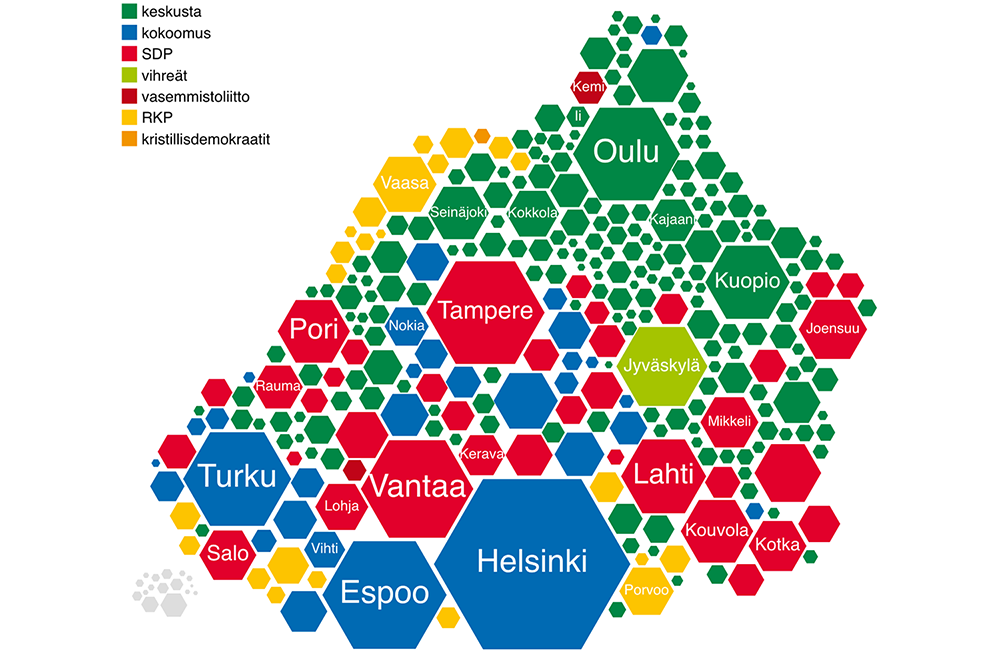
Election map for Aamulehti
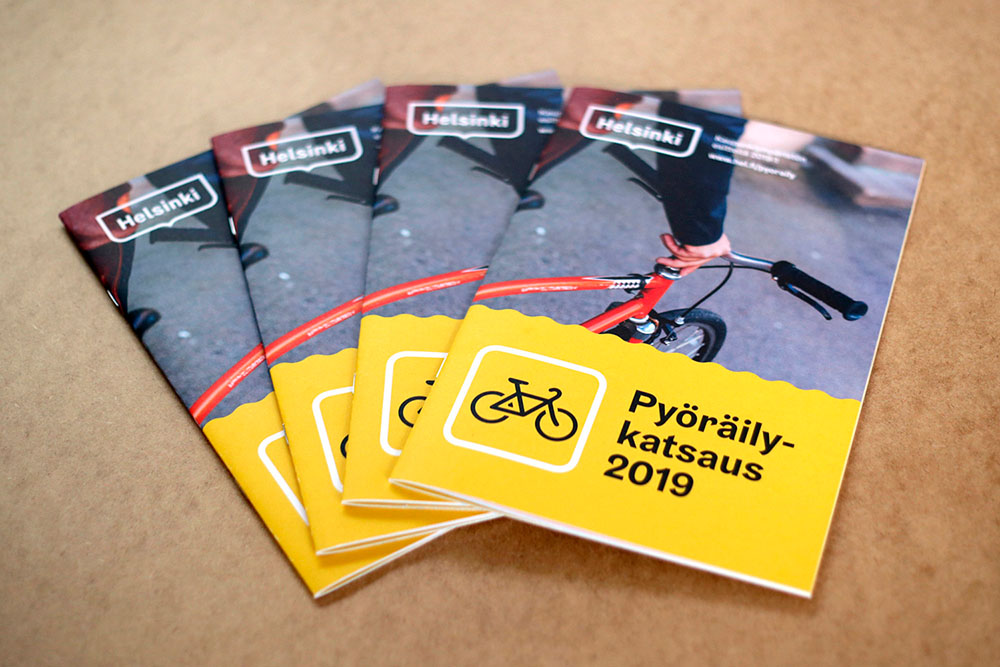
Helsinki Bicycle Account
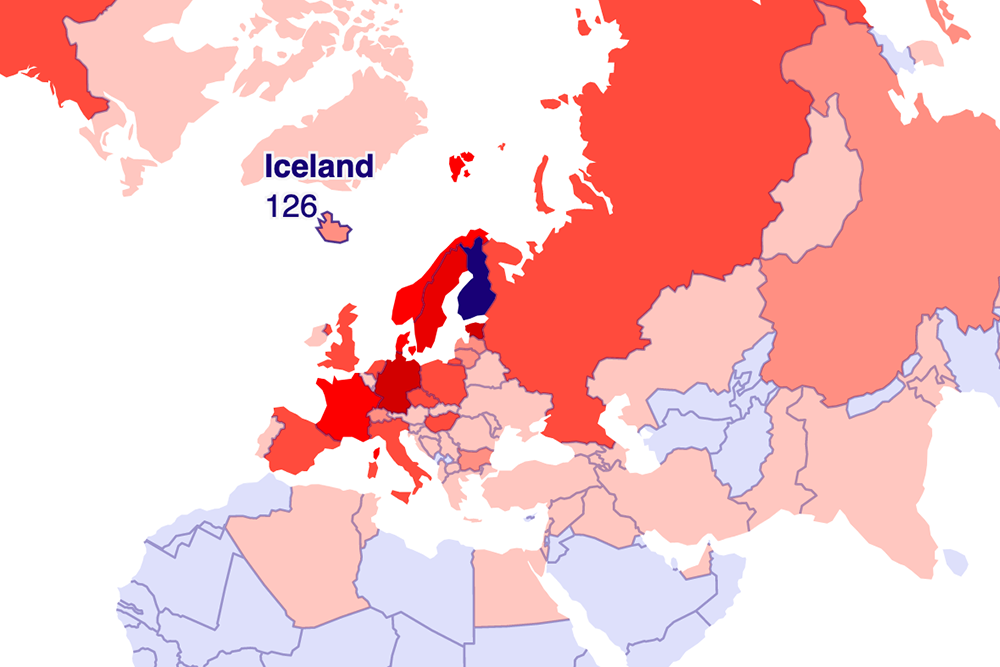
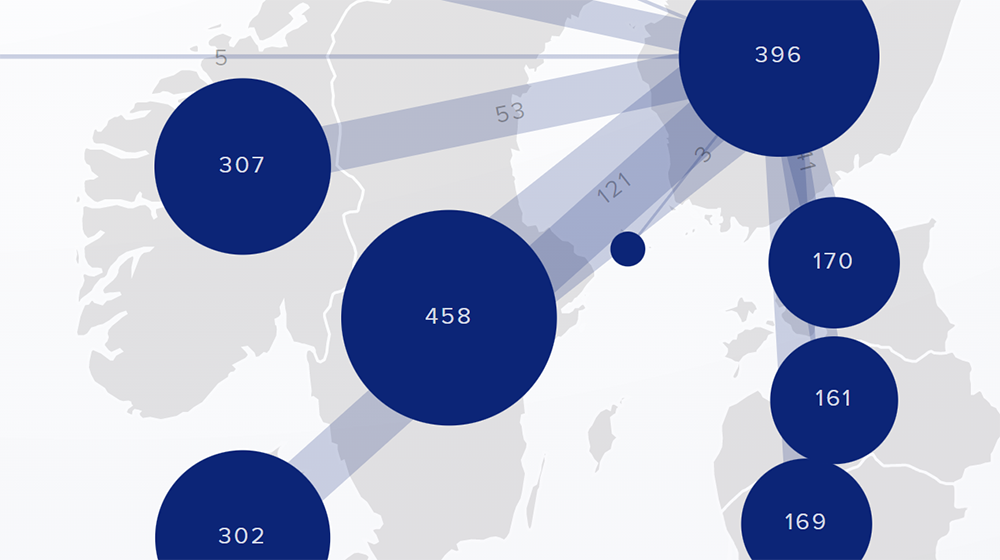
Interactive visualization for Finnish literature Exchange FILI
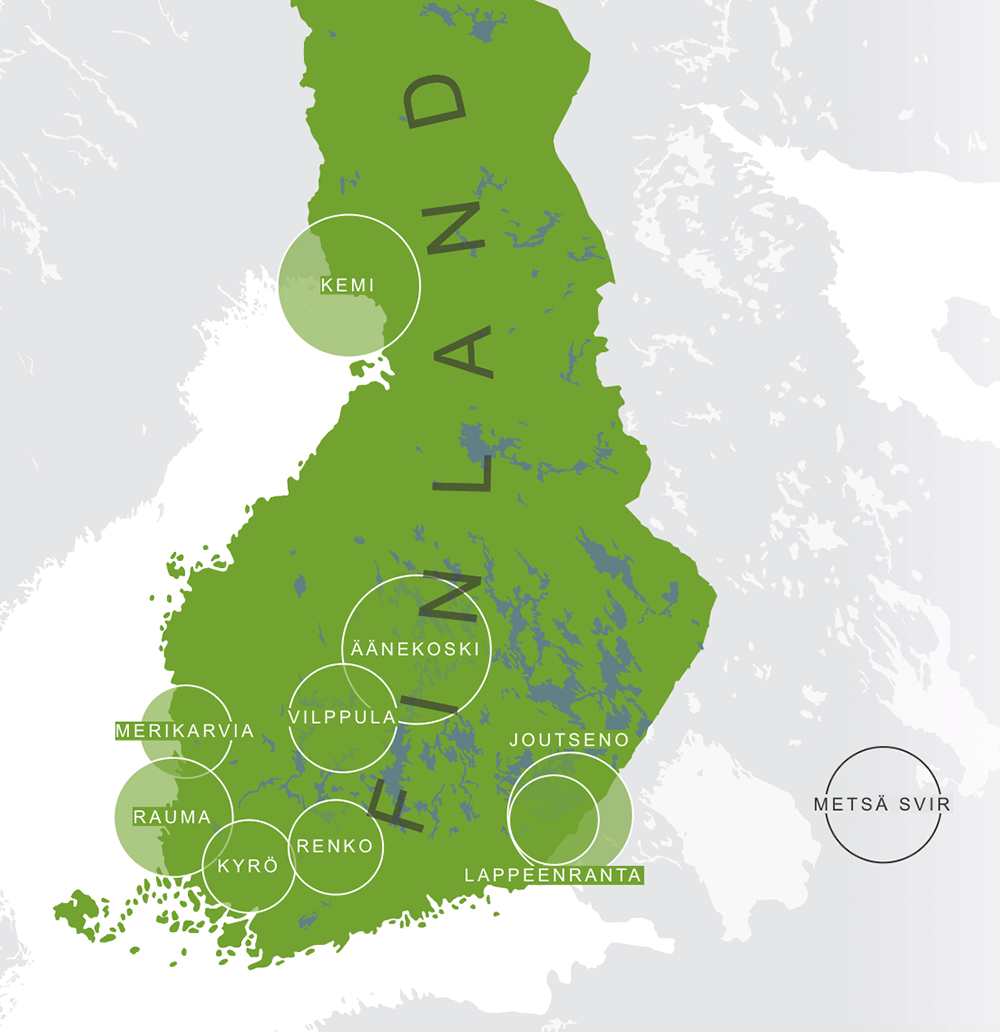
Metsä Fibre annual review