Artists Pekka Niittyvirta and Timo Aho approached us to help make a site-specific artwork called “Lines” into a virtual installation. We worked as a part of a multi-disciplinary team in realizing the project, with a particular focus on data processing and handling, layout and interface design.
Google Maps and the Street View camera are ubiquitous and neutral, which we used to build on an emotionally detached platform. This gives space to the viewer’s own interpretation, where familiar imagery is subtly modified.
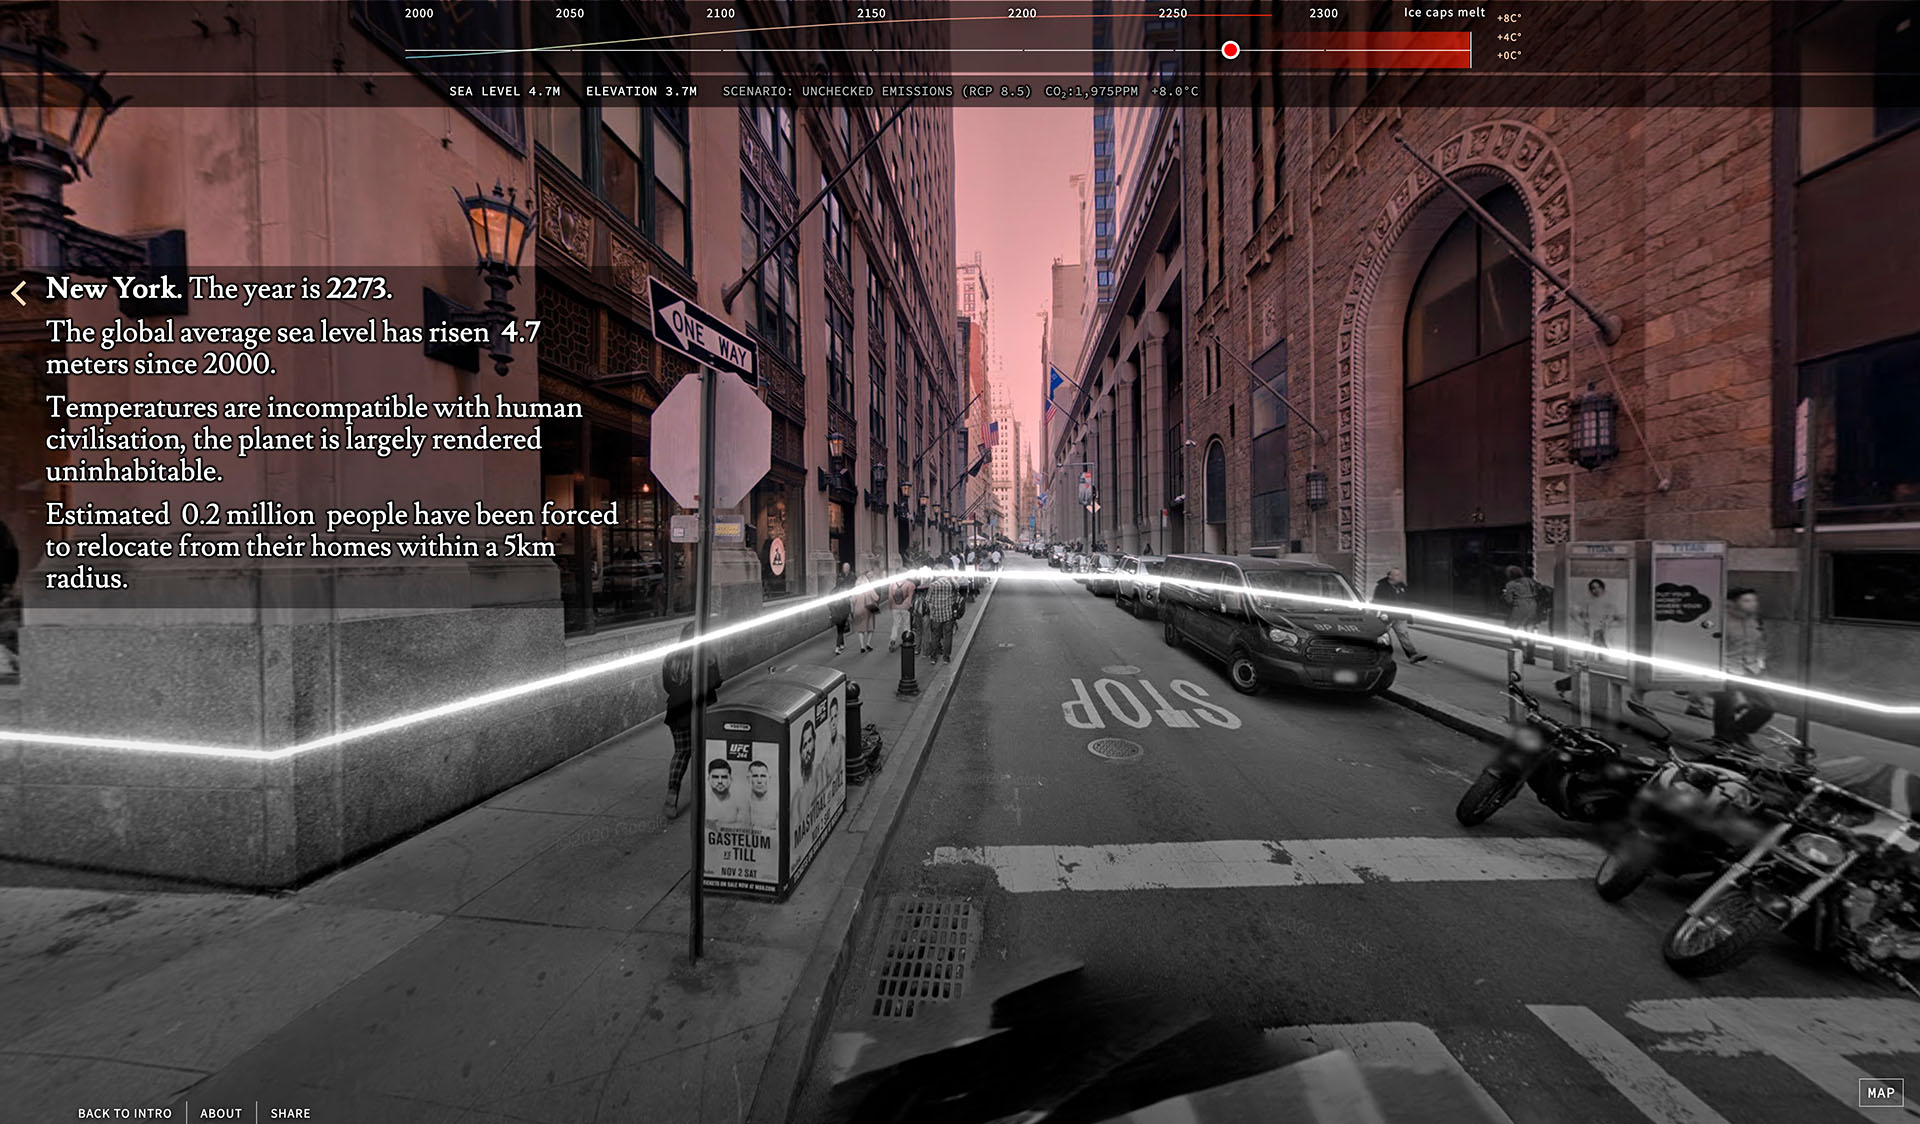
We treated the world as a finite and common unit: The map is stripped from any borders between countries, to emphasize the global nature of climate change.
Viljami Peltola built the map view, while Henry Jalonen did additional backend work. To create the experience of viewing rising sea levels at different locations, the developers Janne Aukia and Ville Niemi built a 3d line drawing component into the Google Photo Spheres.
The project uses Climate Central’s CoastalDEM elevation model and the geospatial was hosted on Google’s web-based geospatial analysis toolkit Earth Engine.
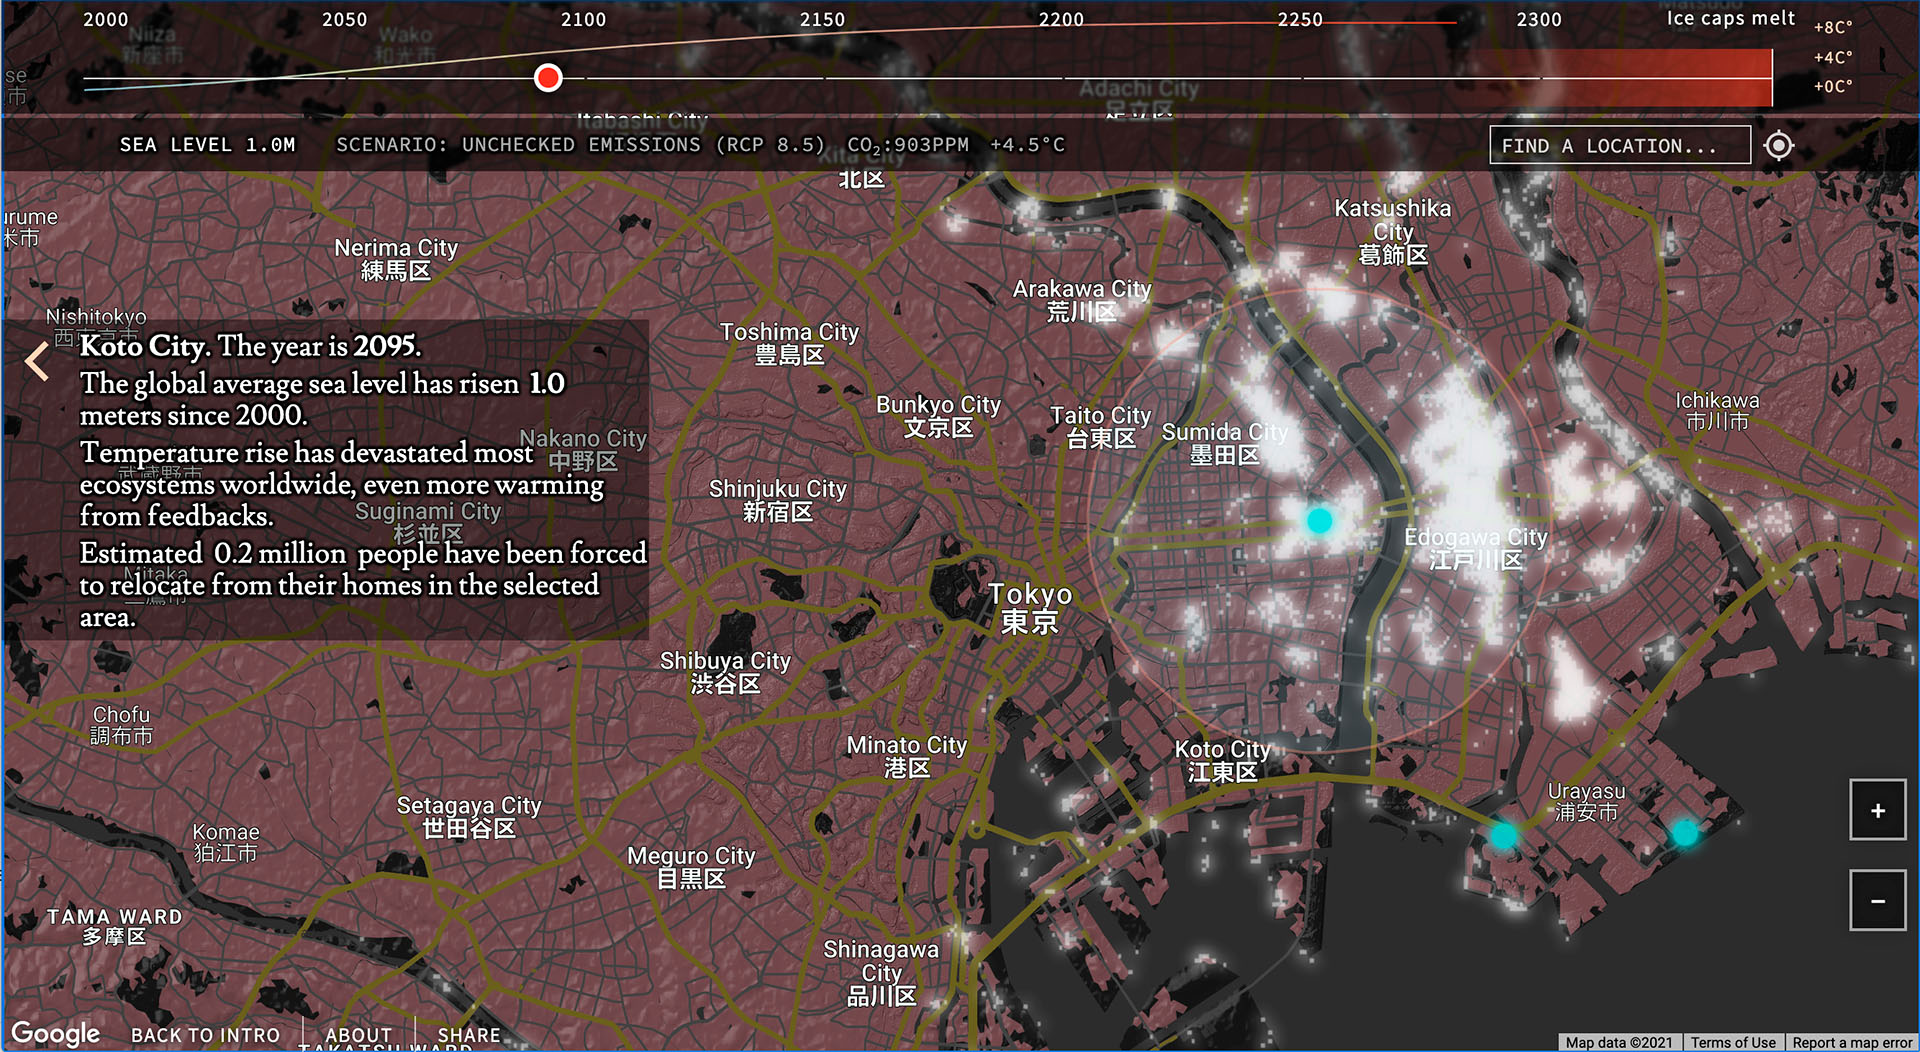
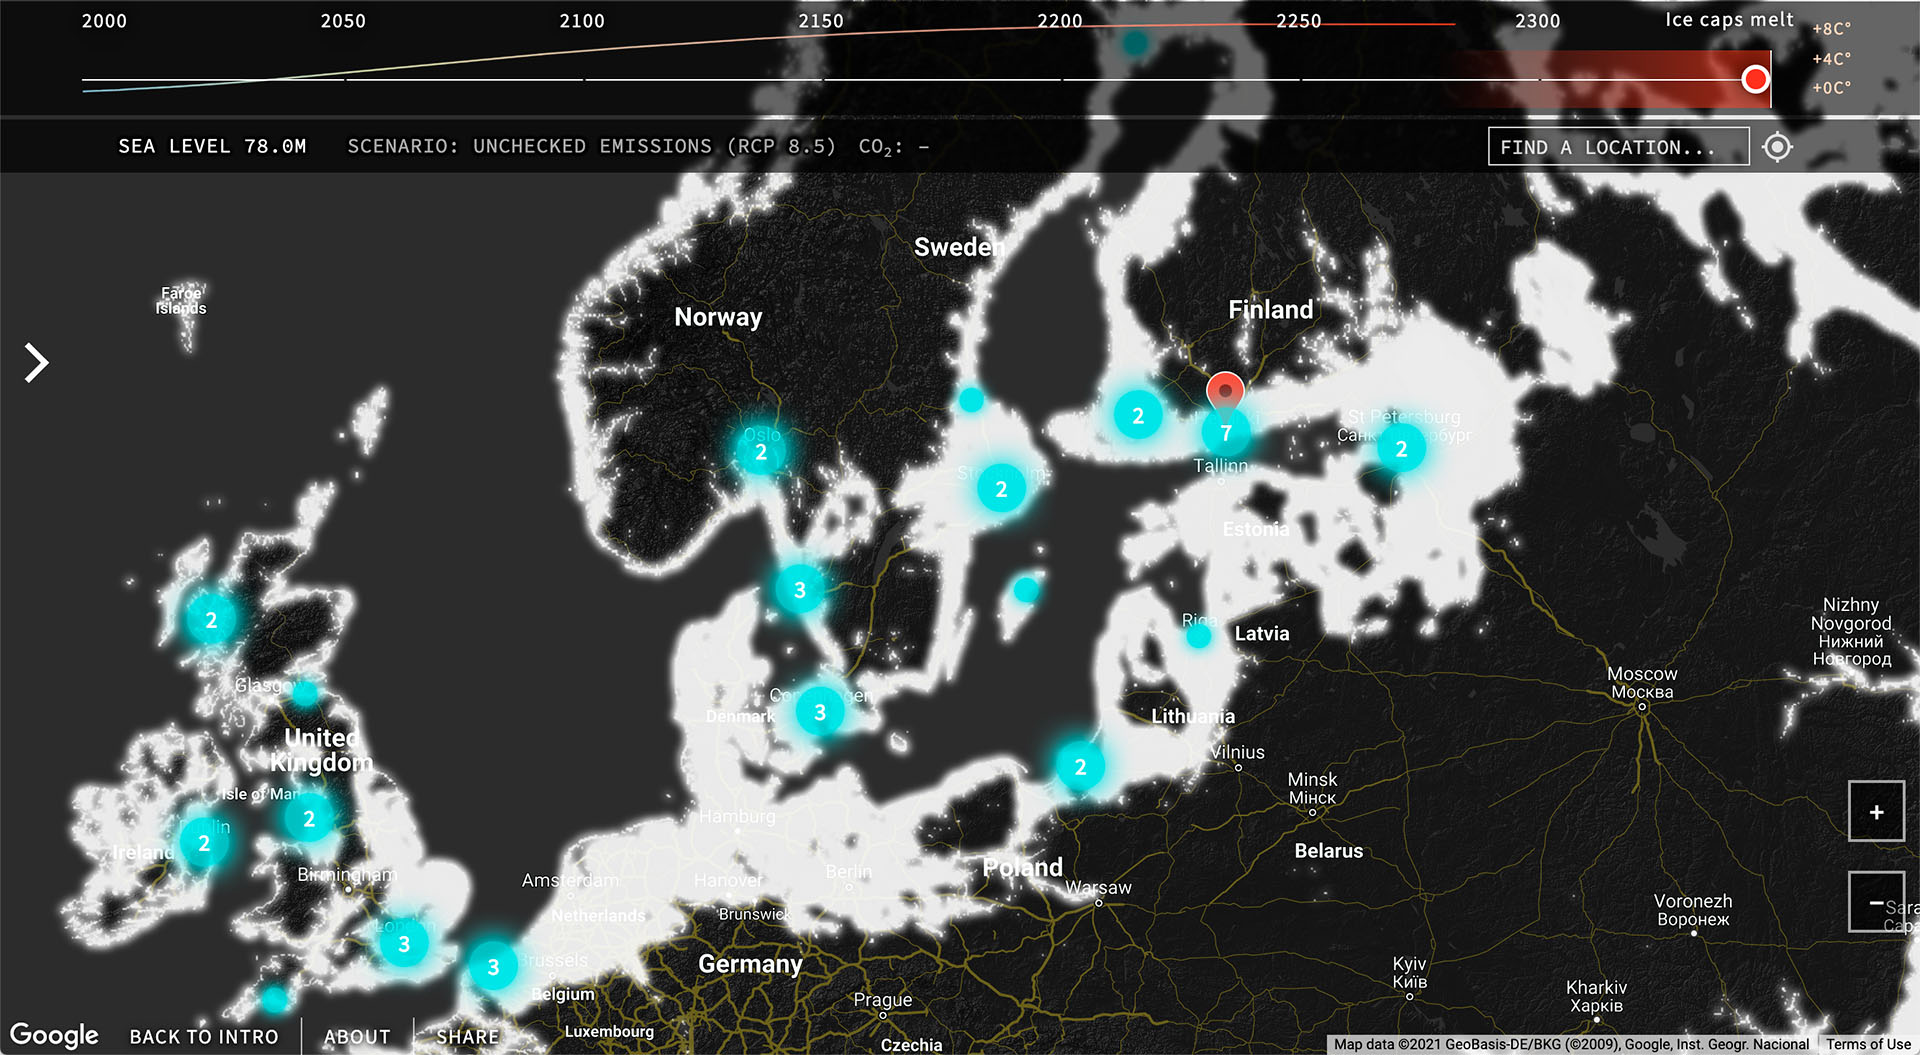
Emissions and temperature data follows the highest emissions scenario by the Intergovernmental Panel on Climate Change, the so-called Representative Concentration Pathway 8.5, which represents high and rising CO2 emissions. This scenario has sometimes been called ”business as usual” but it is an extreme outcome which is now considerer unlikely by most climate scientists.