Selected infographics
Various clients
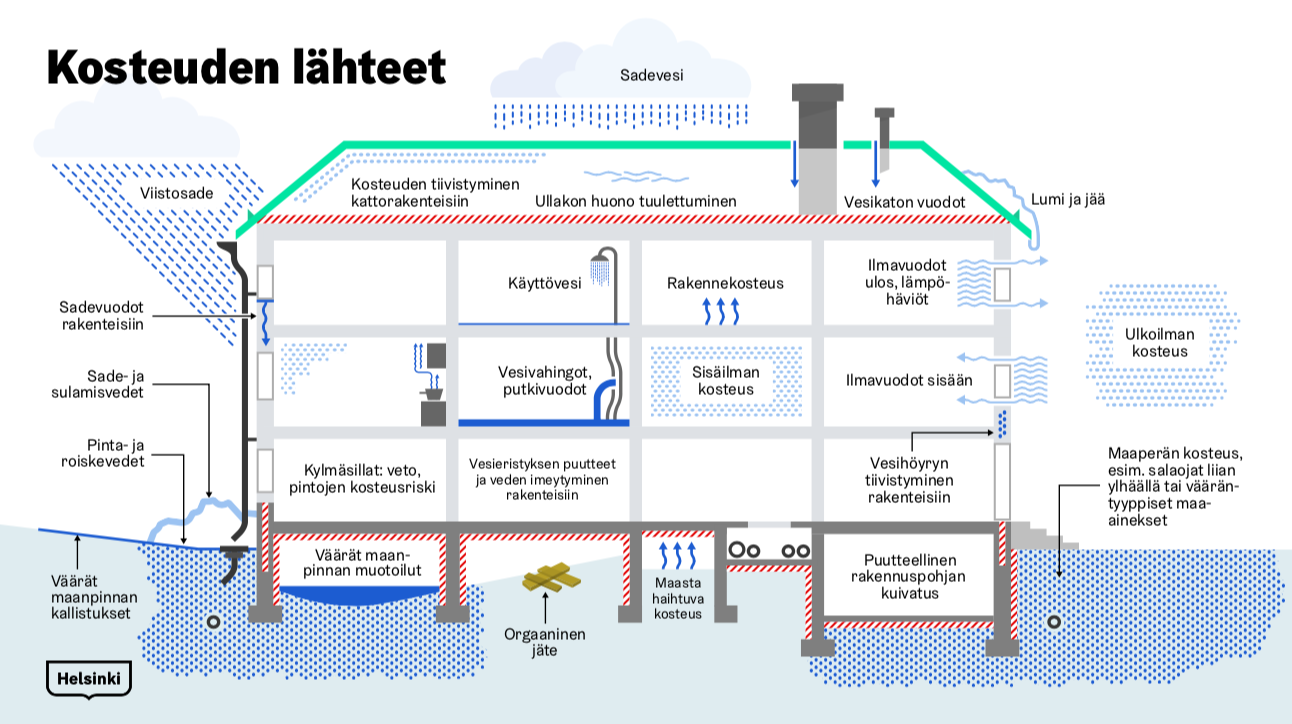
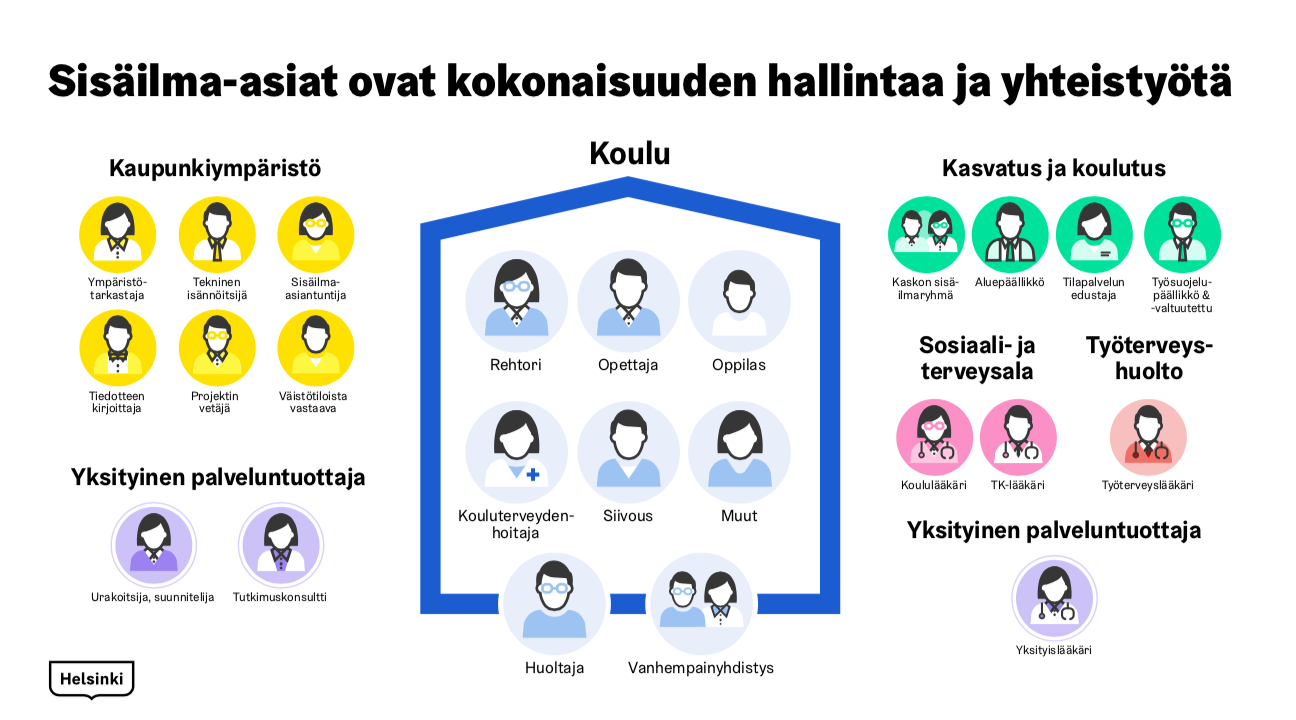
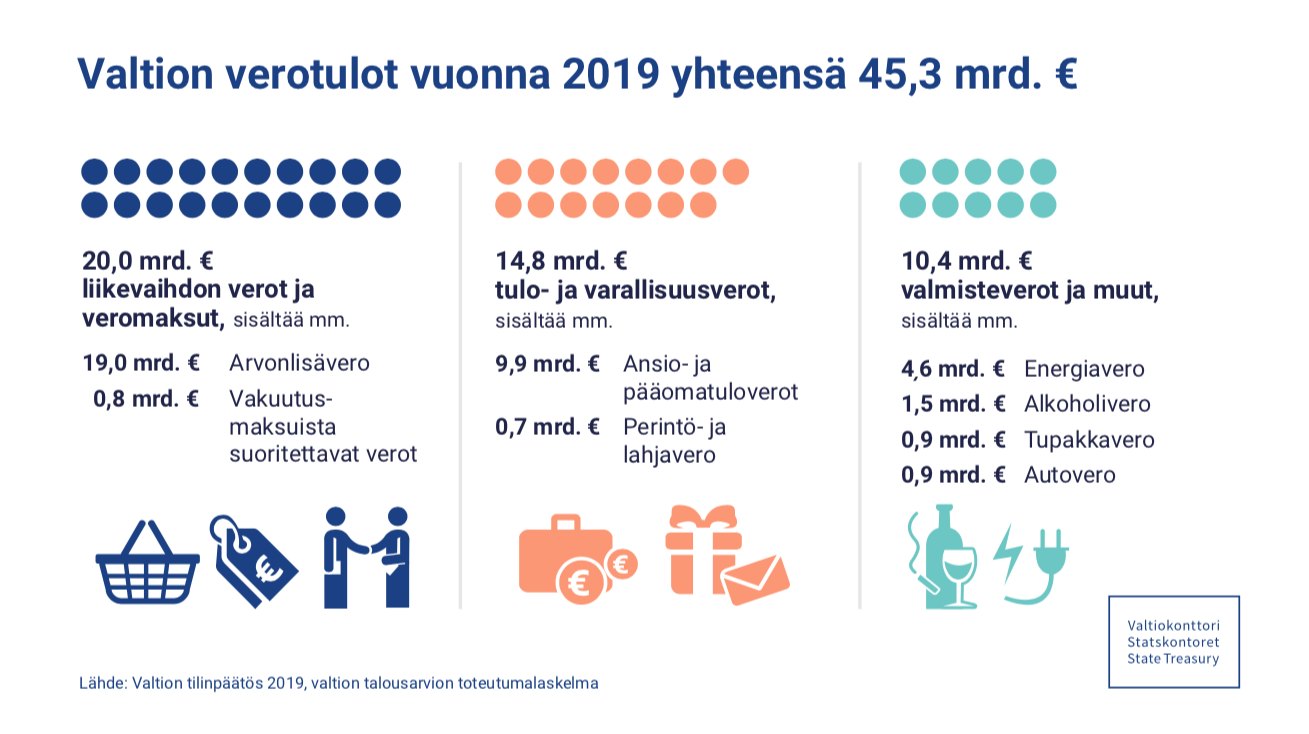
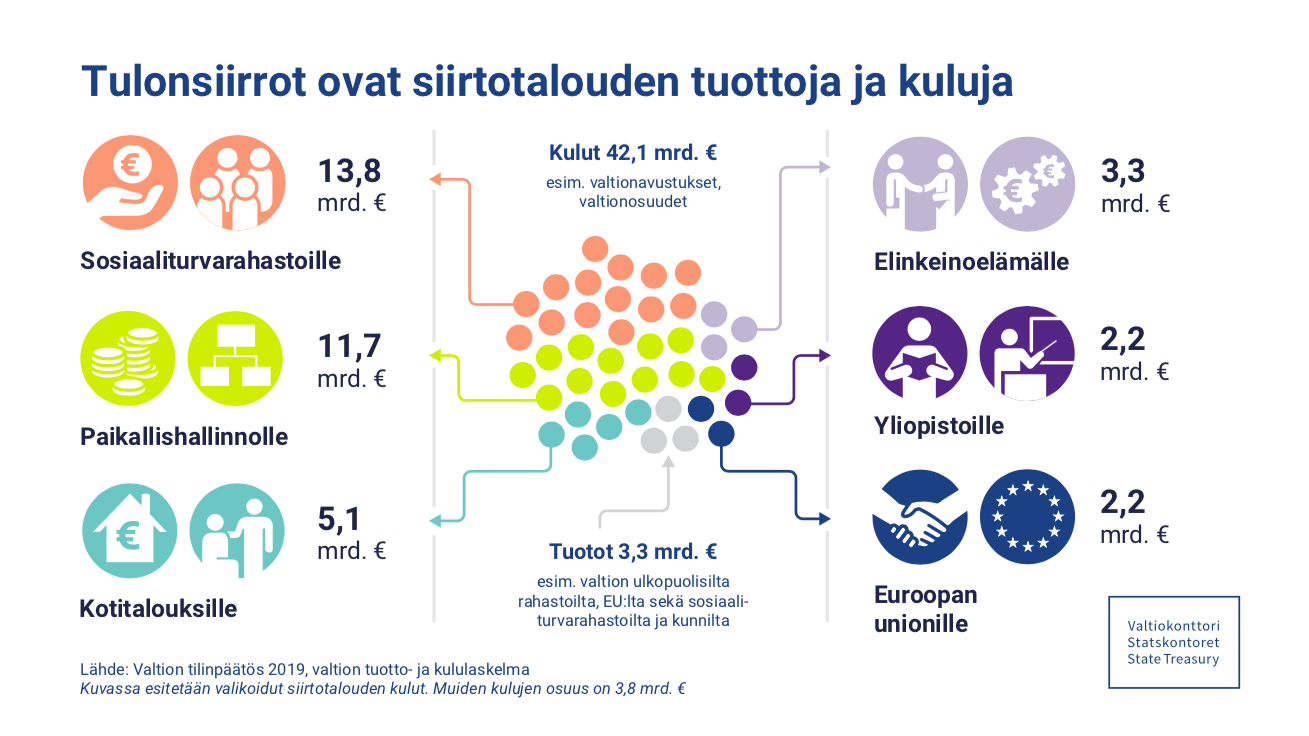
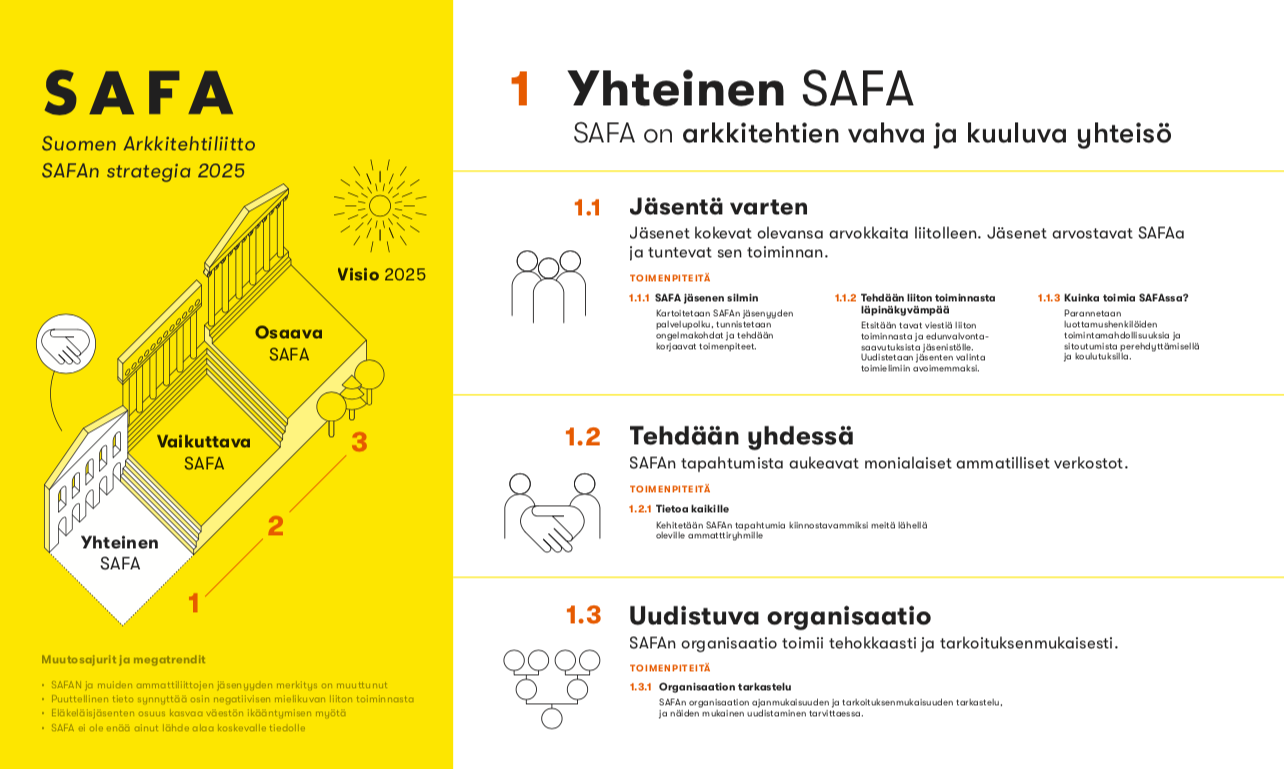
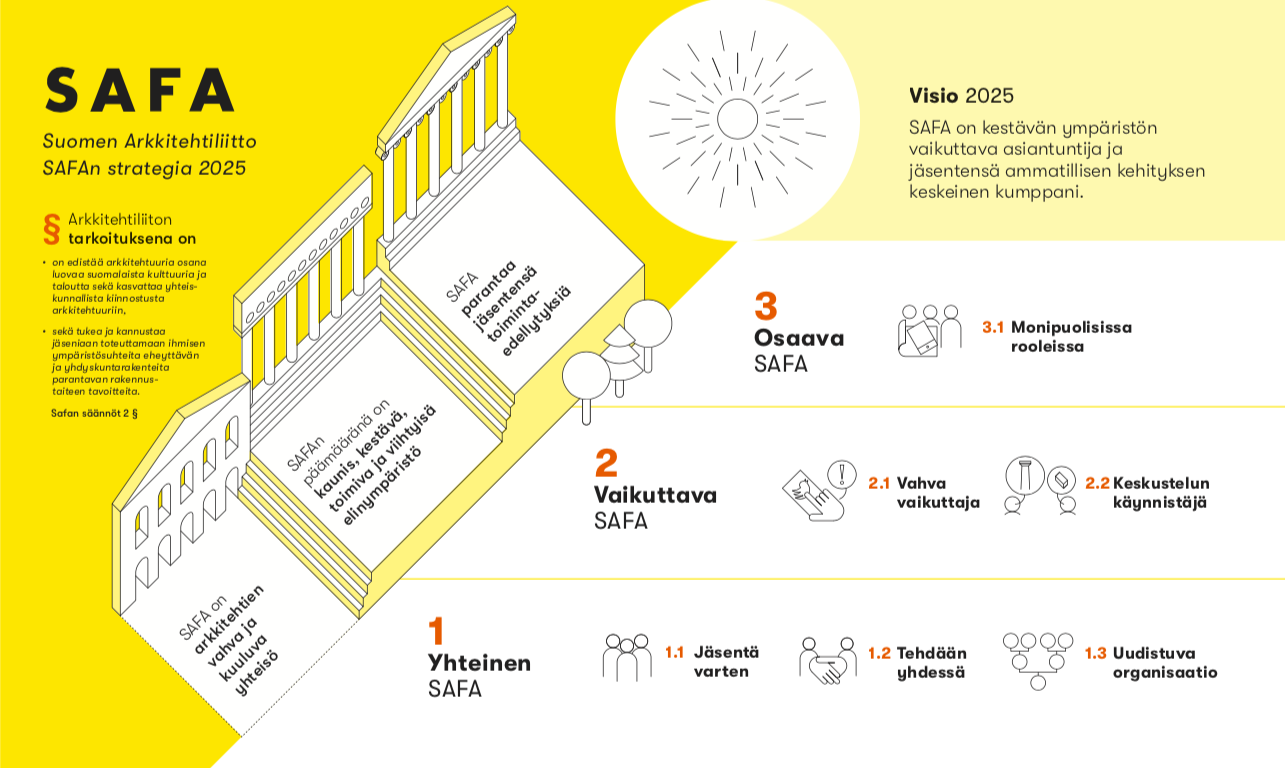
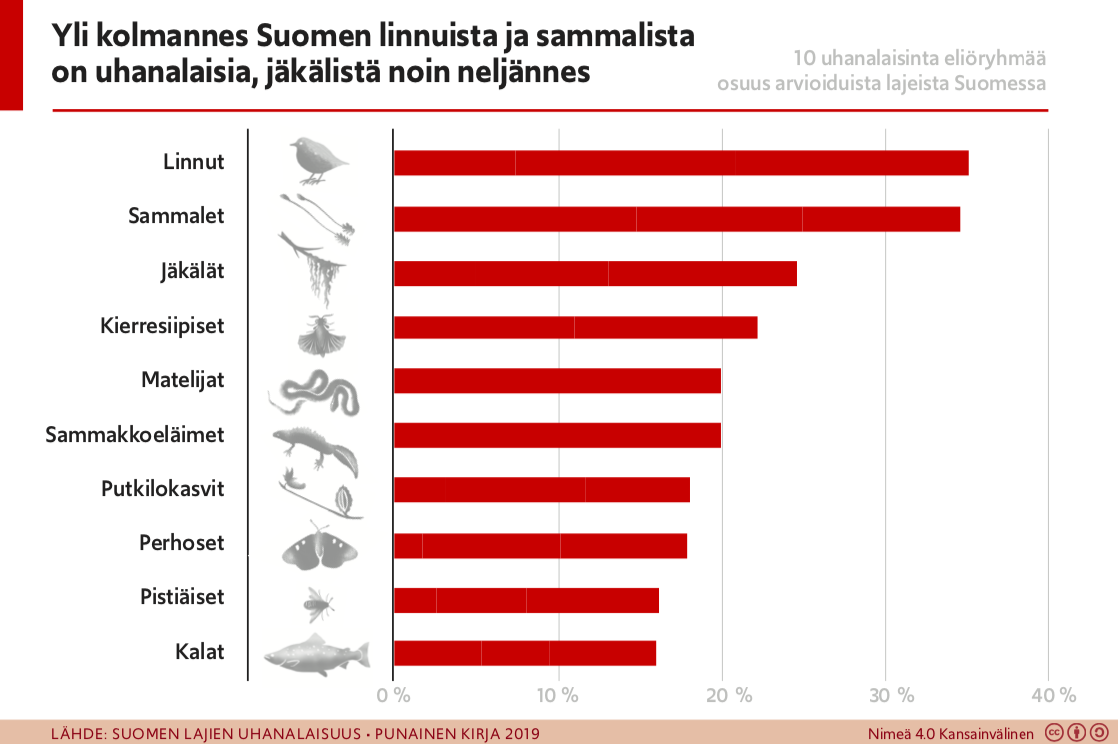
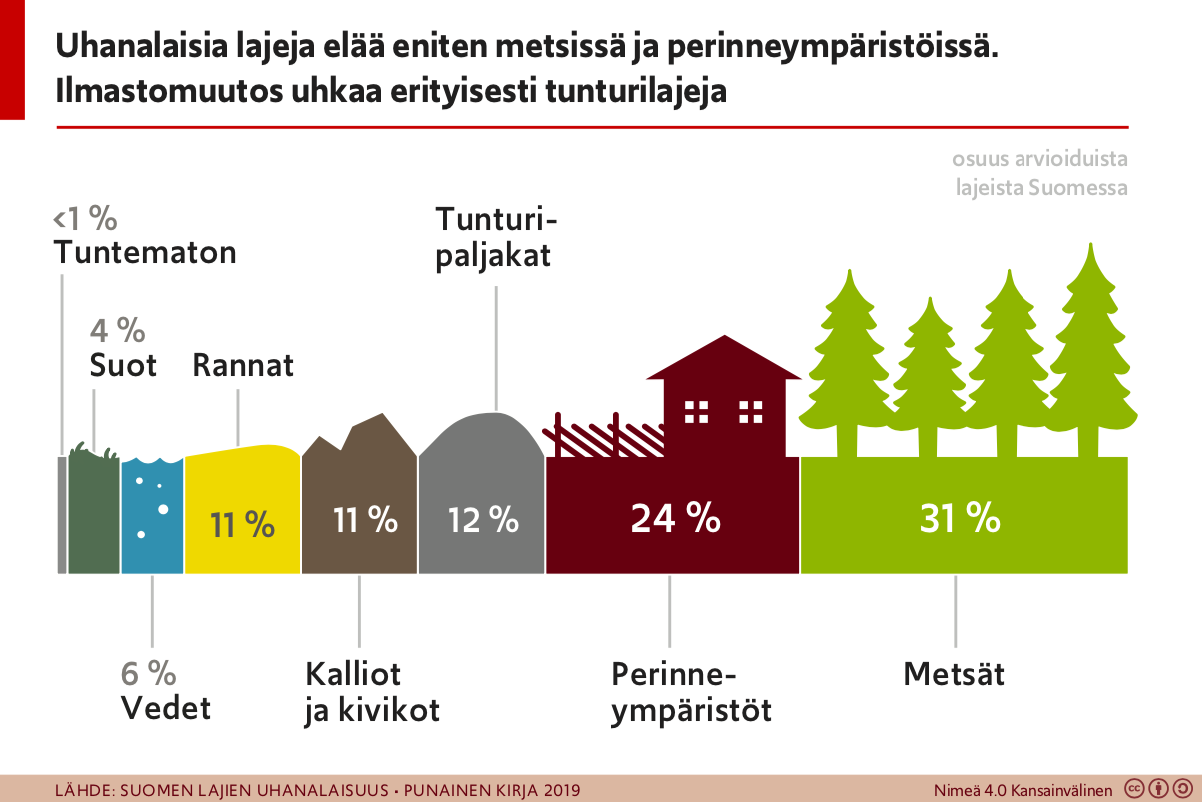
Infographics for a variety of clients, on topics such as sufficiency, climate change, natural diversity and indoor air quality.
VisualisationGraphic designInformation design
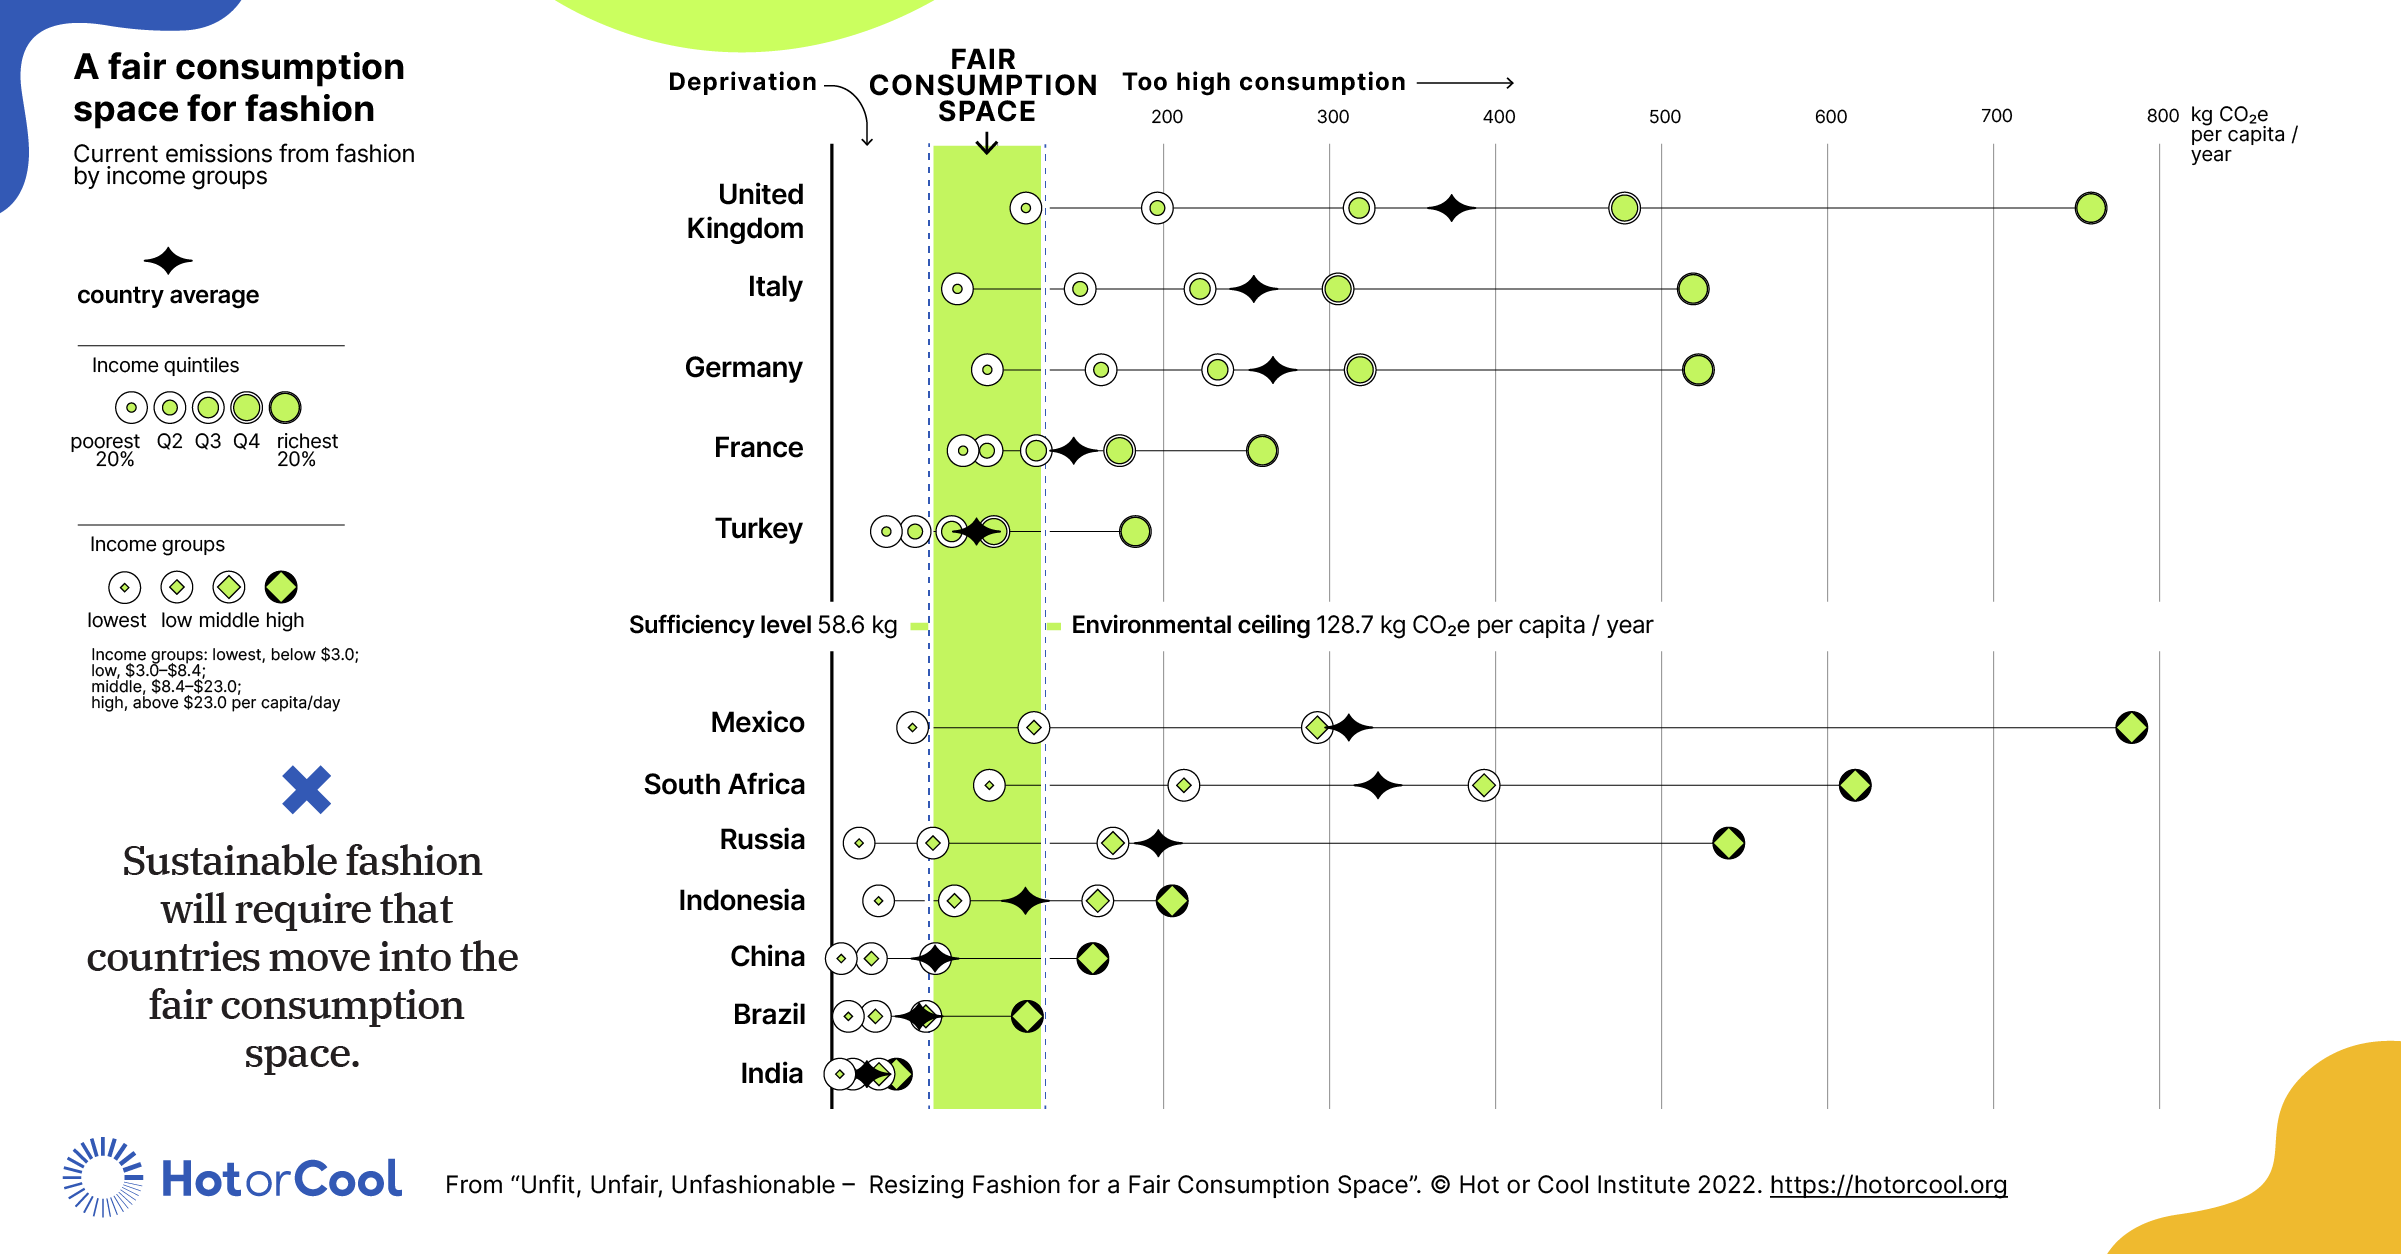
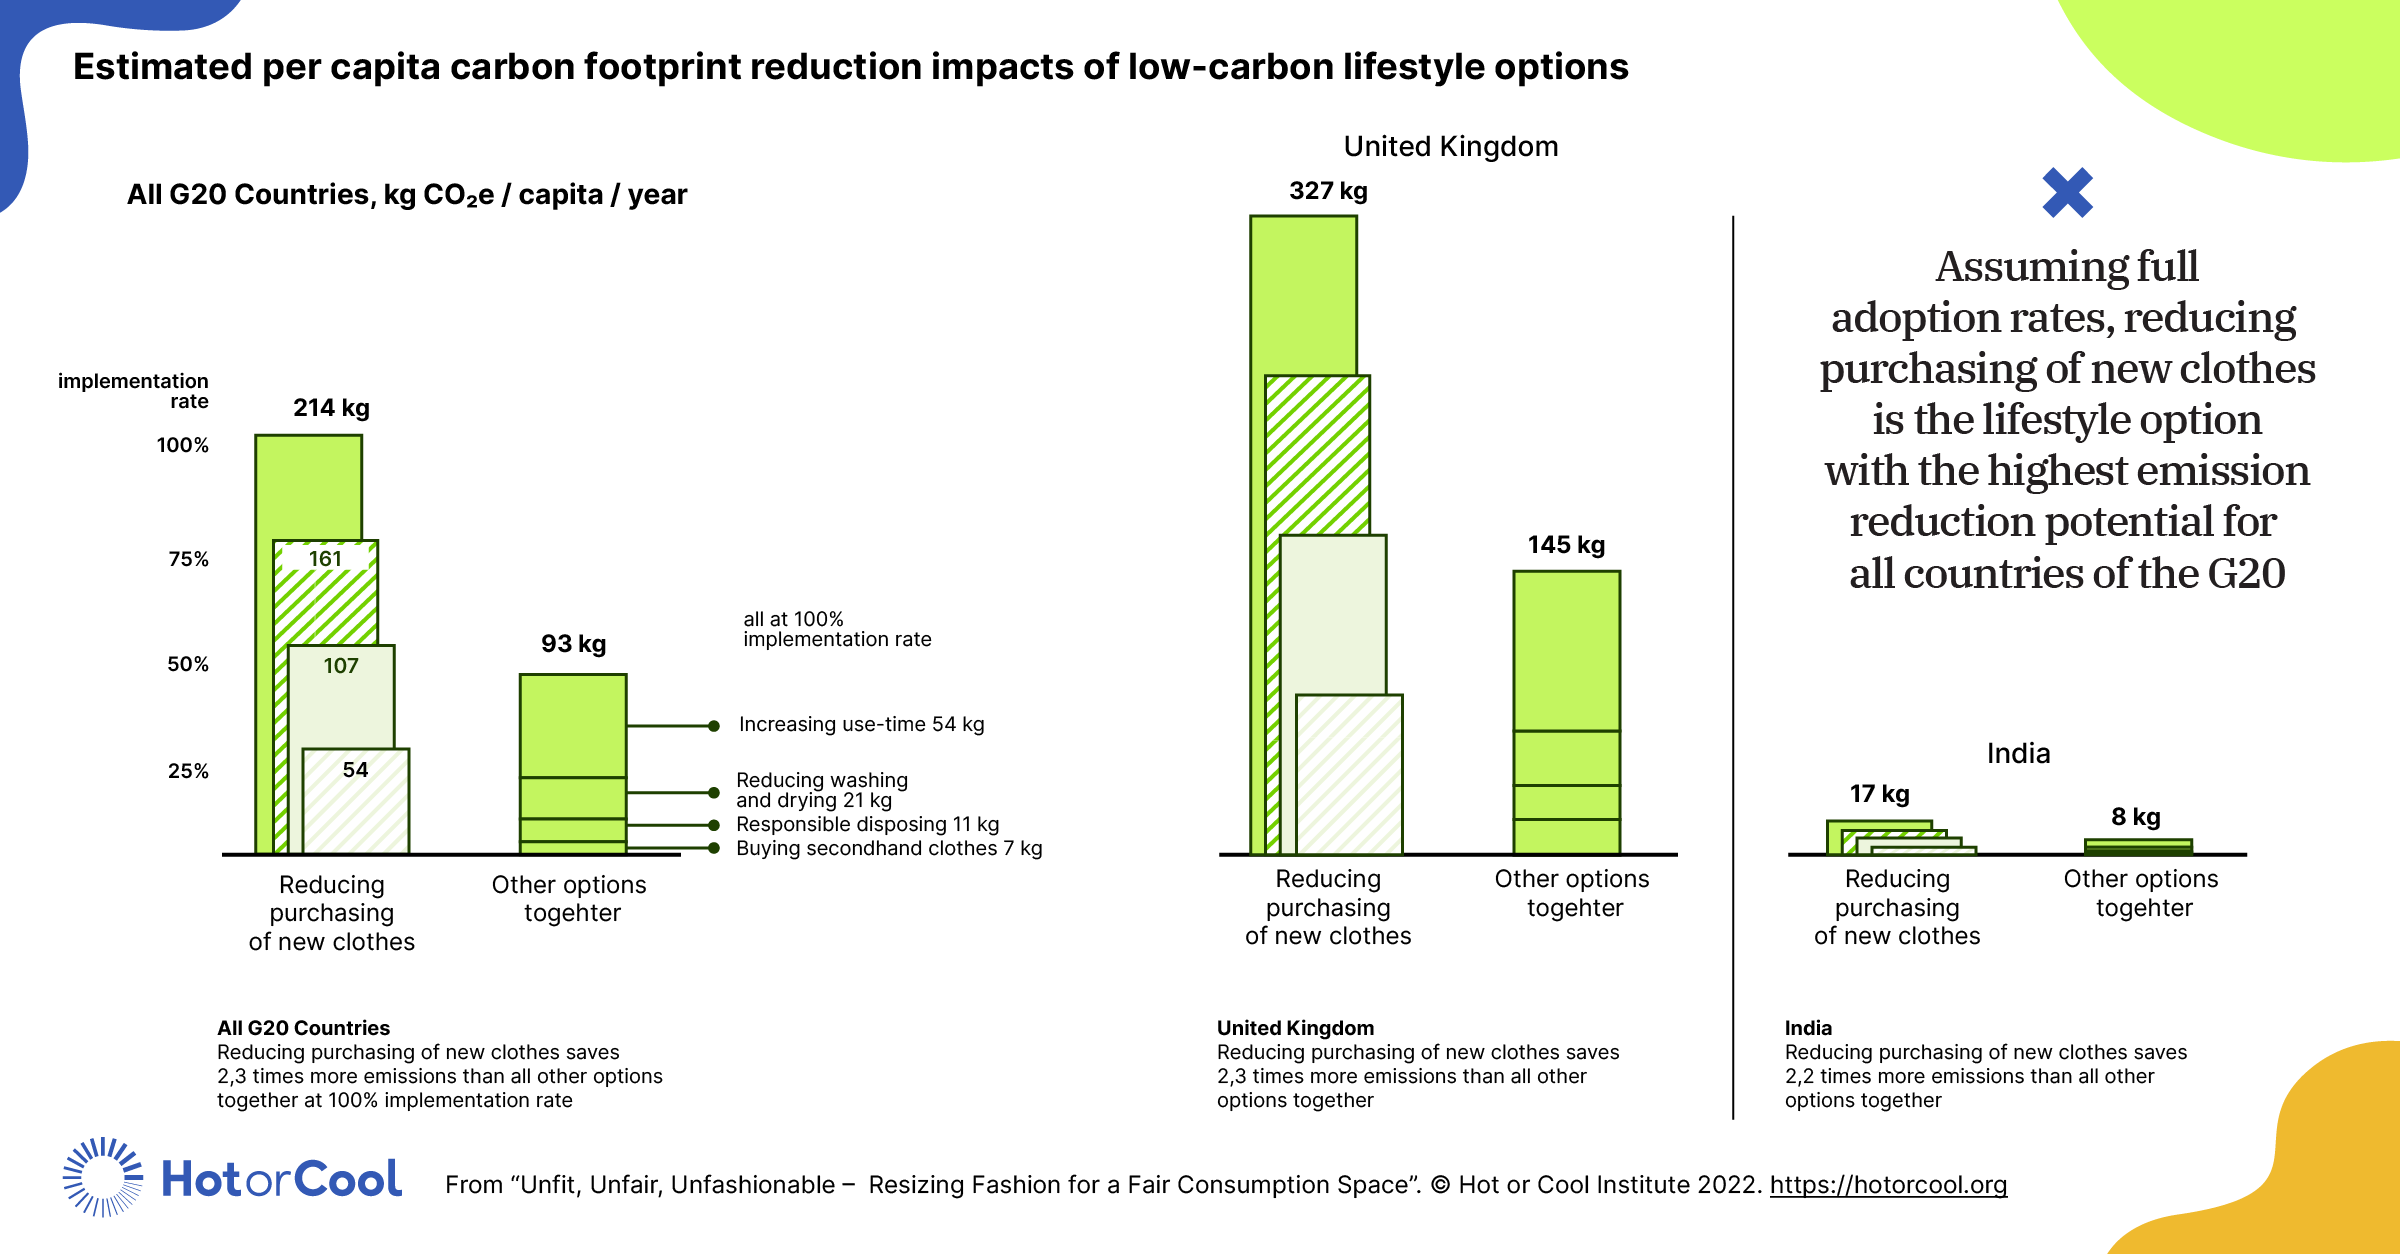
Download the full report: https://hotorcool.org/unfit-unfair-unfashionable/
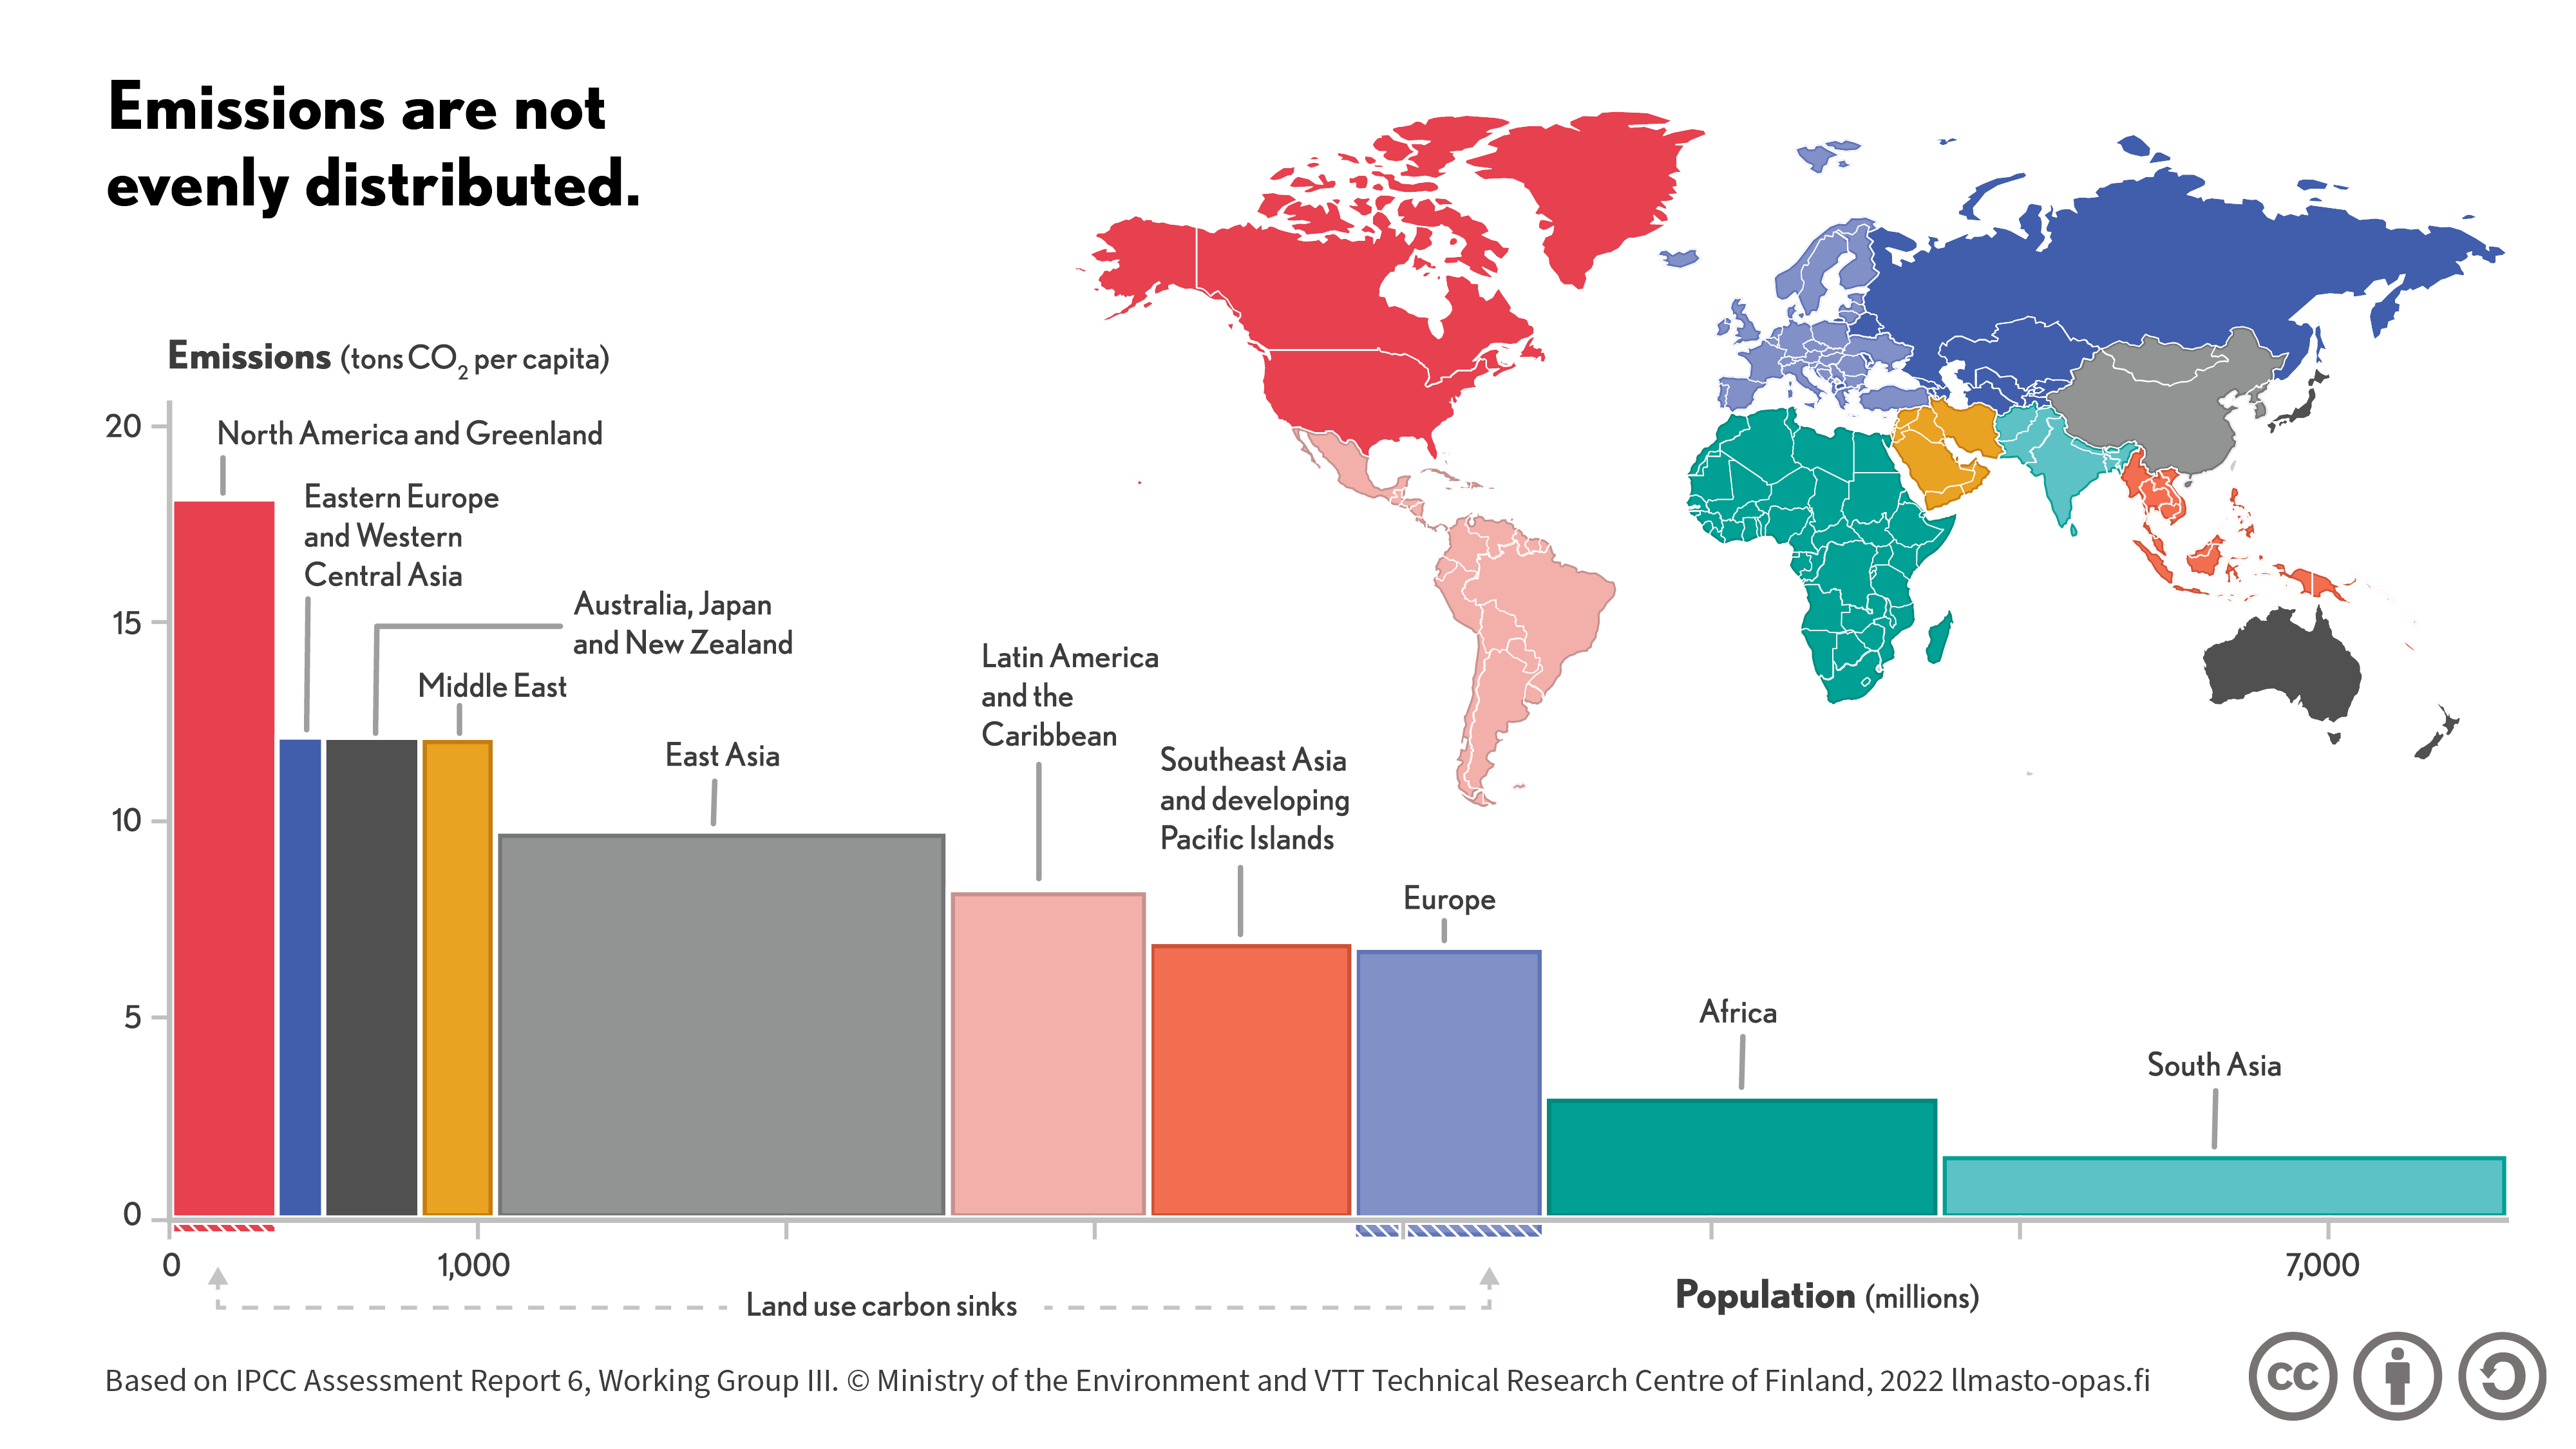
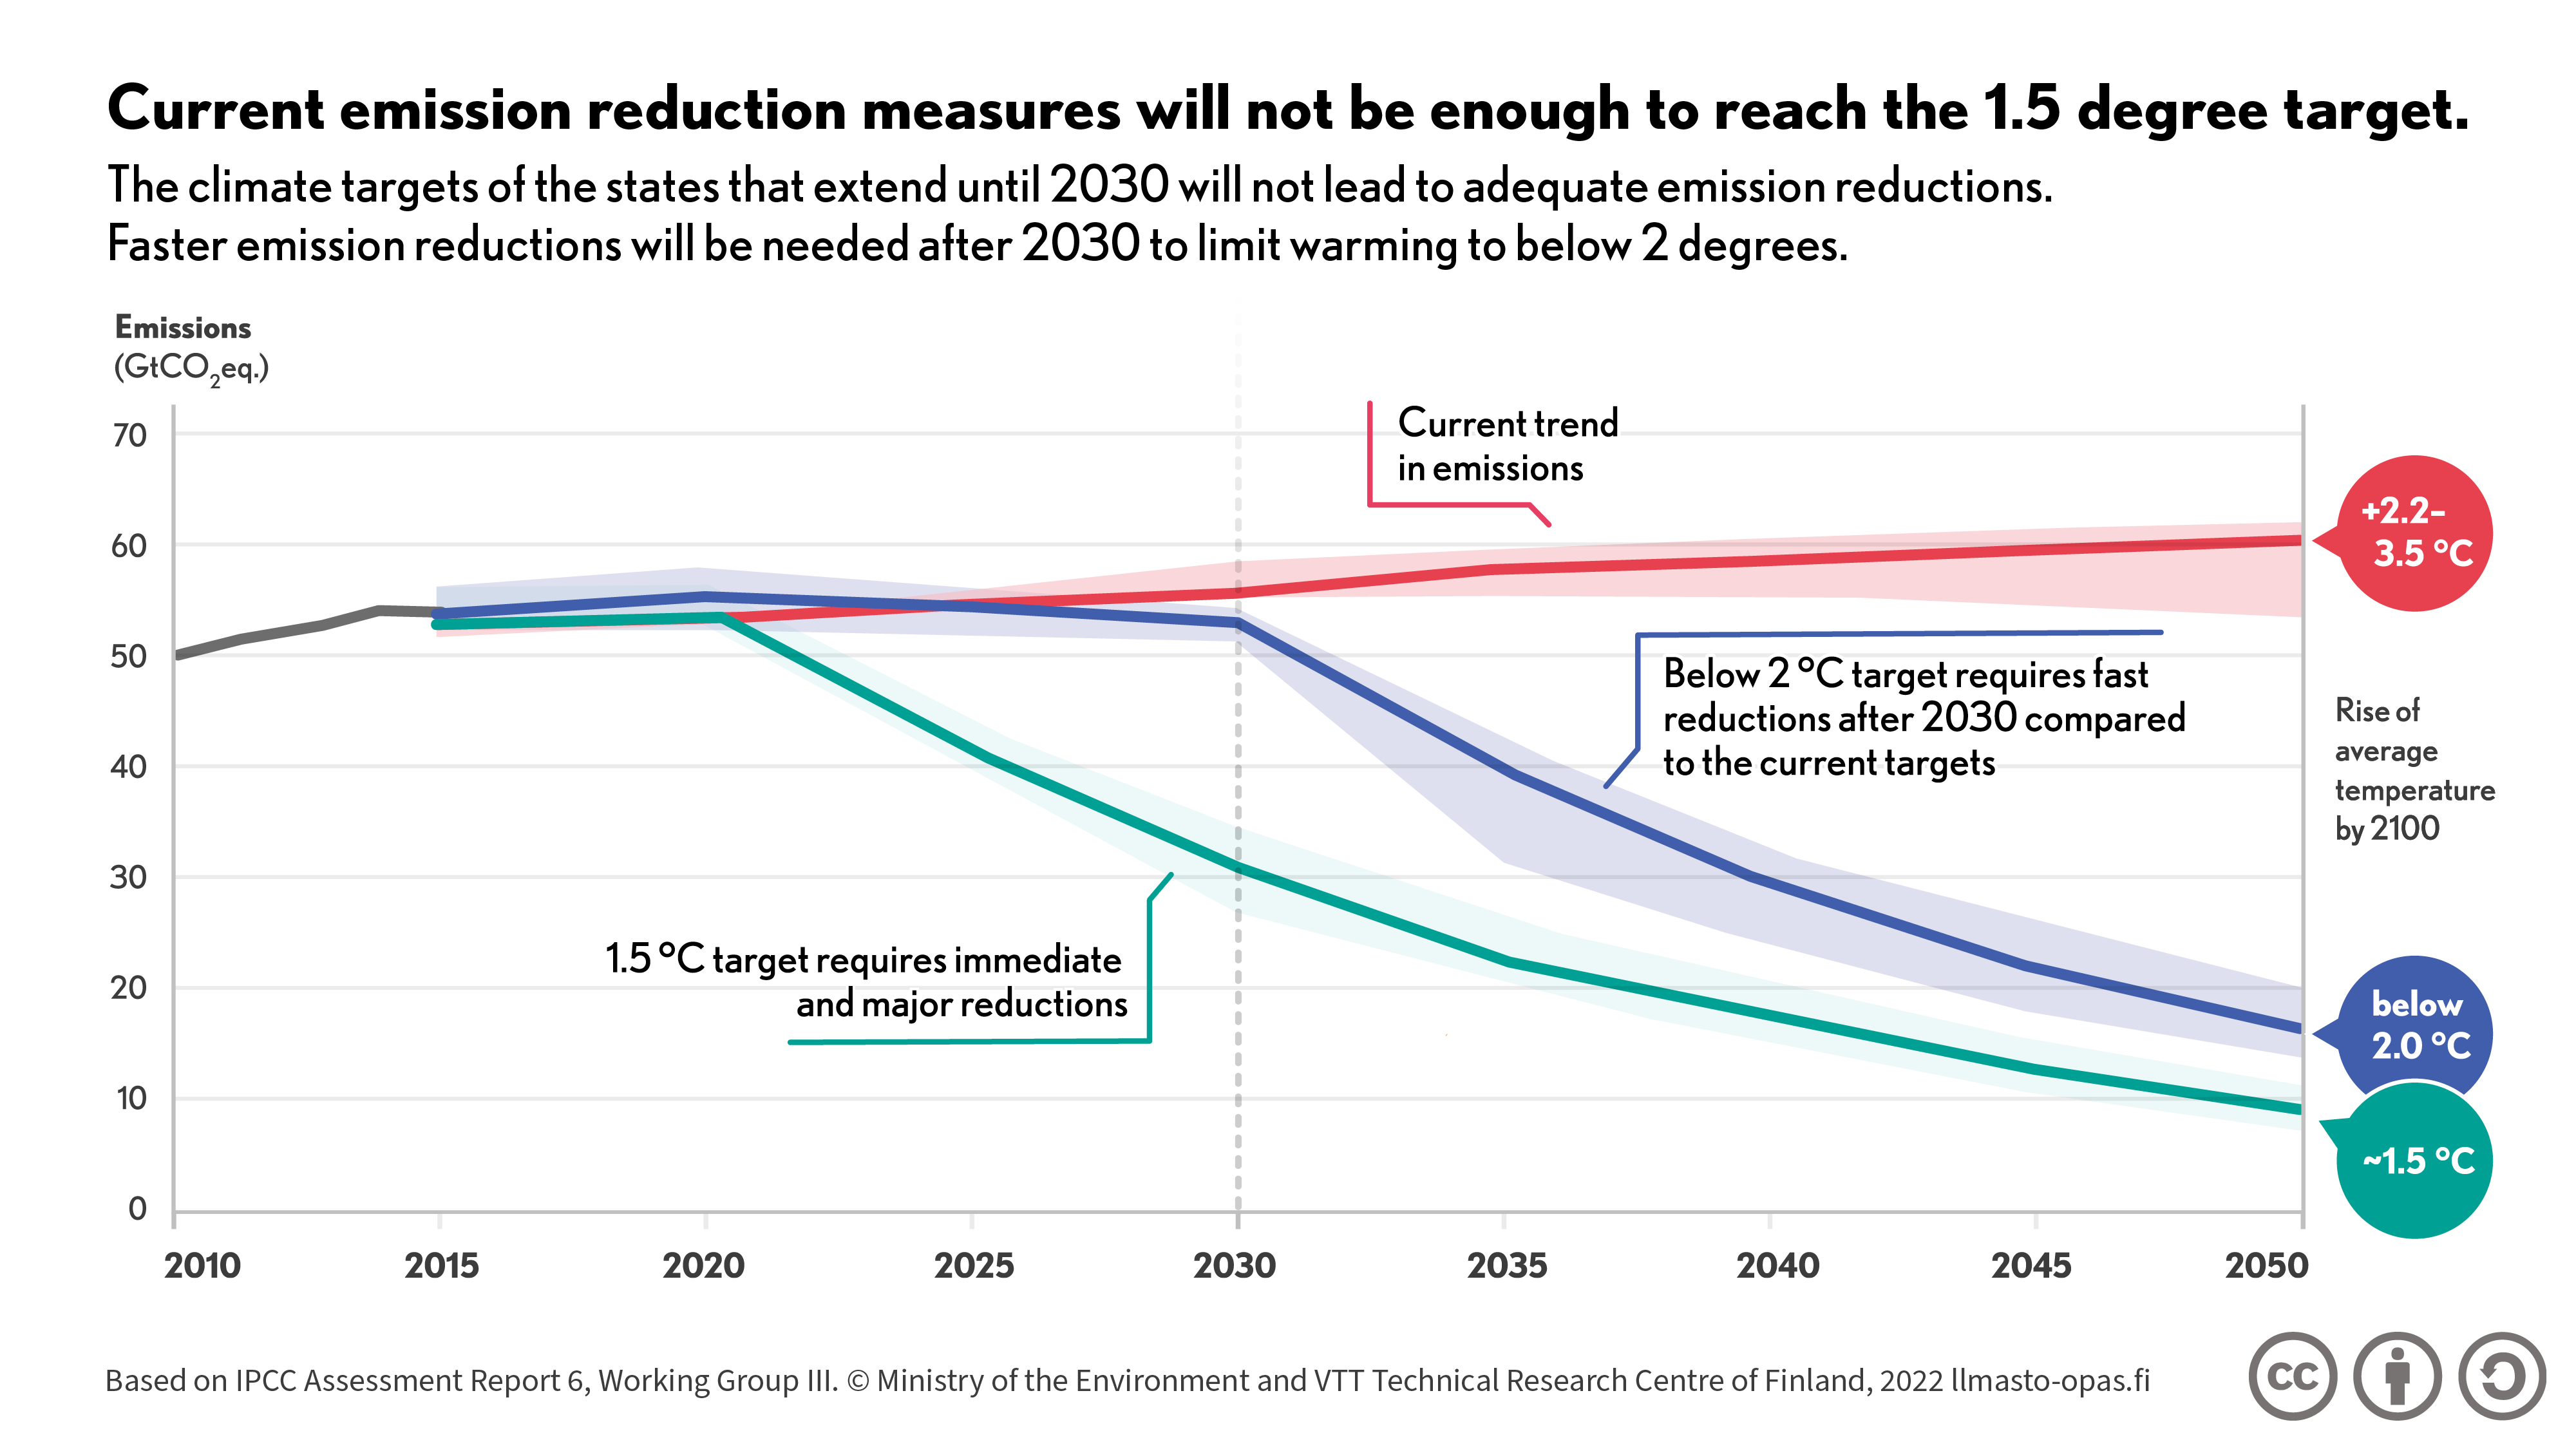
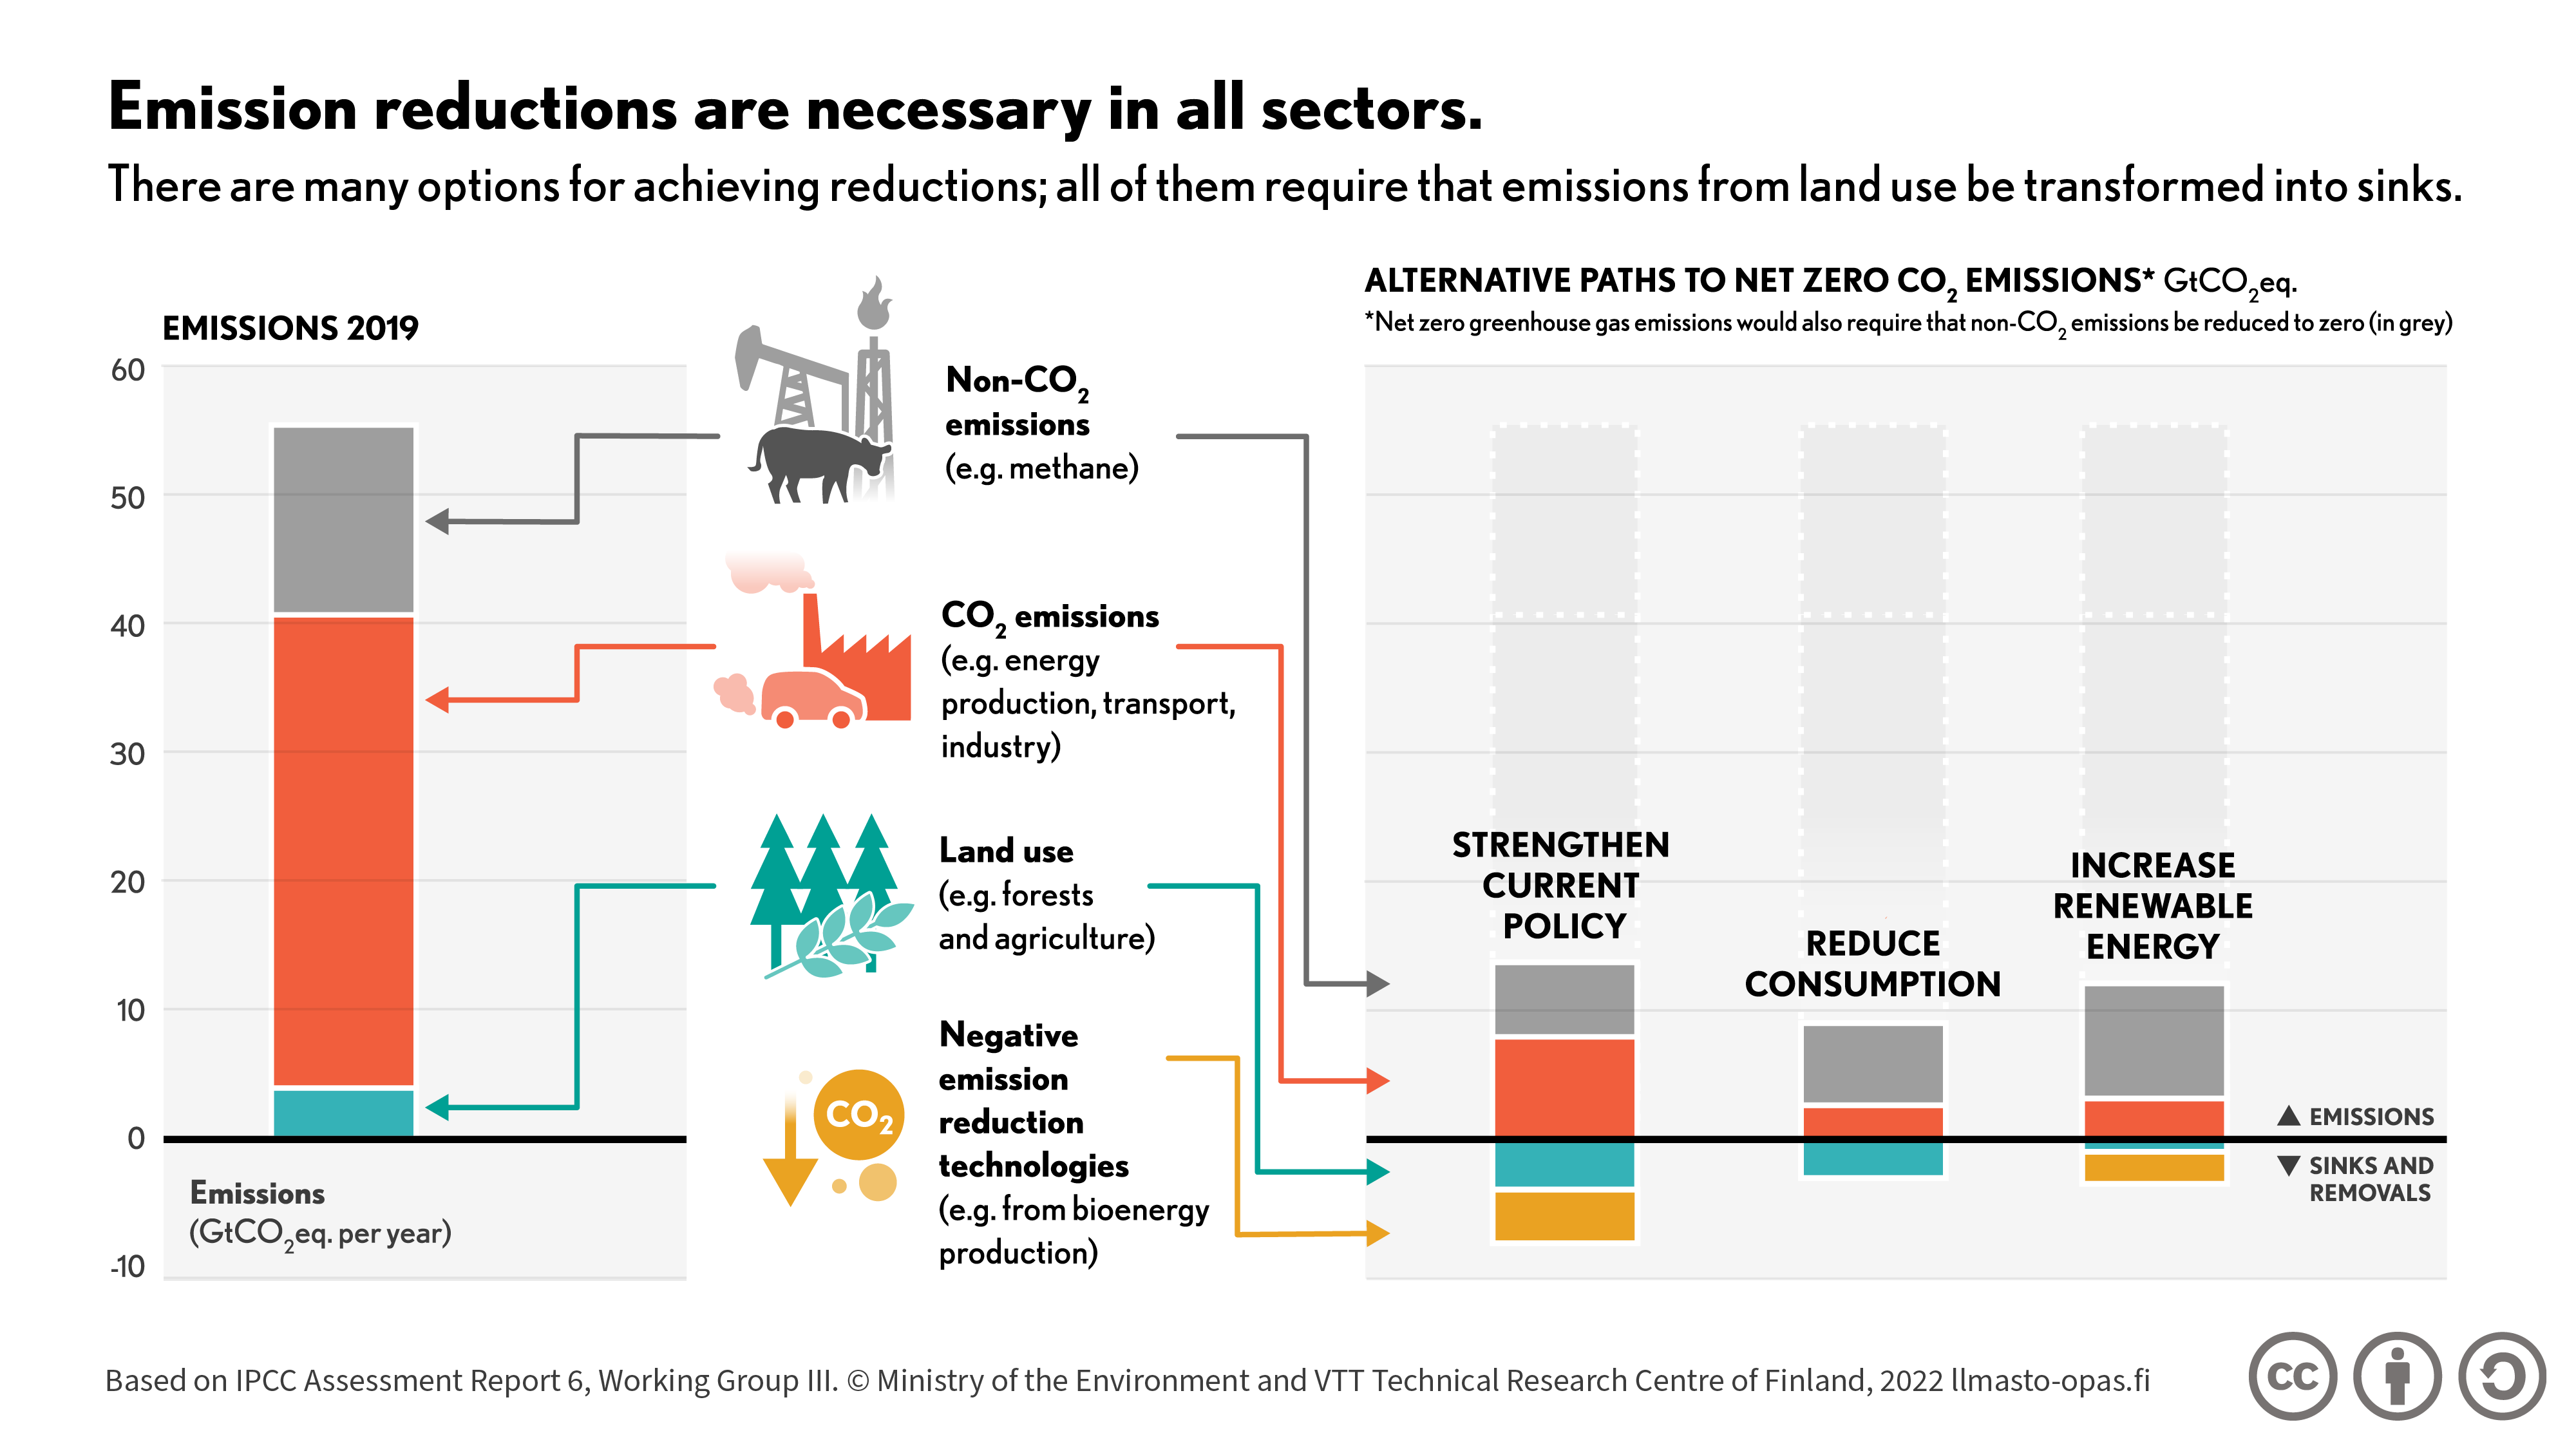
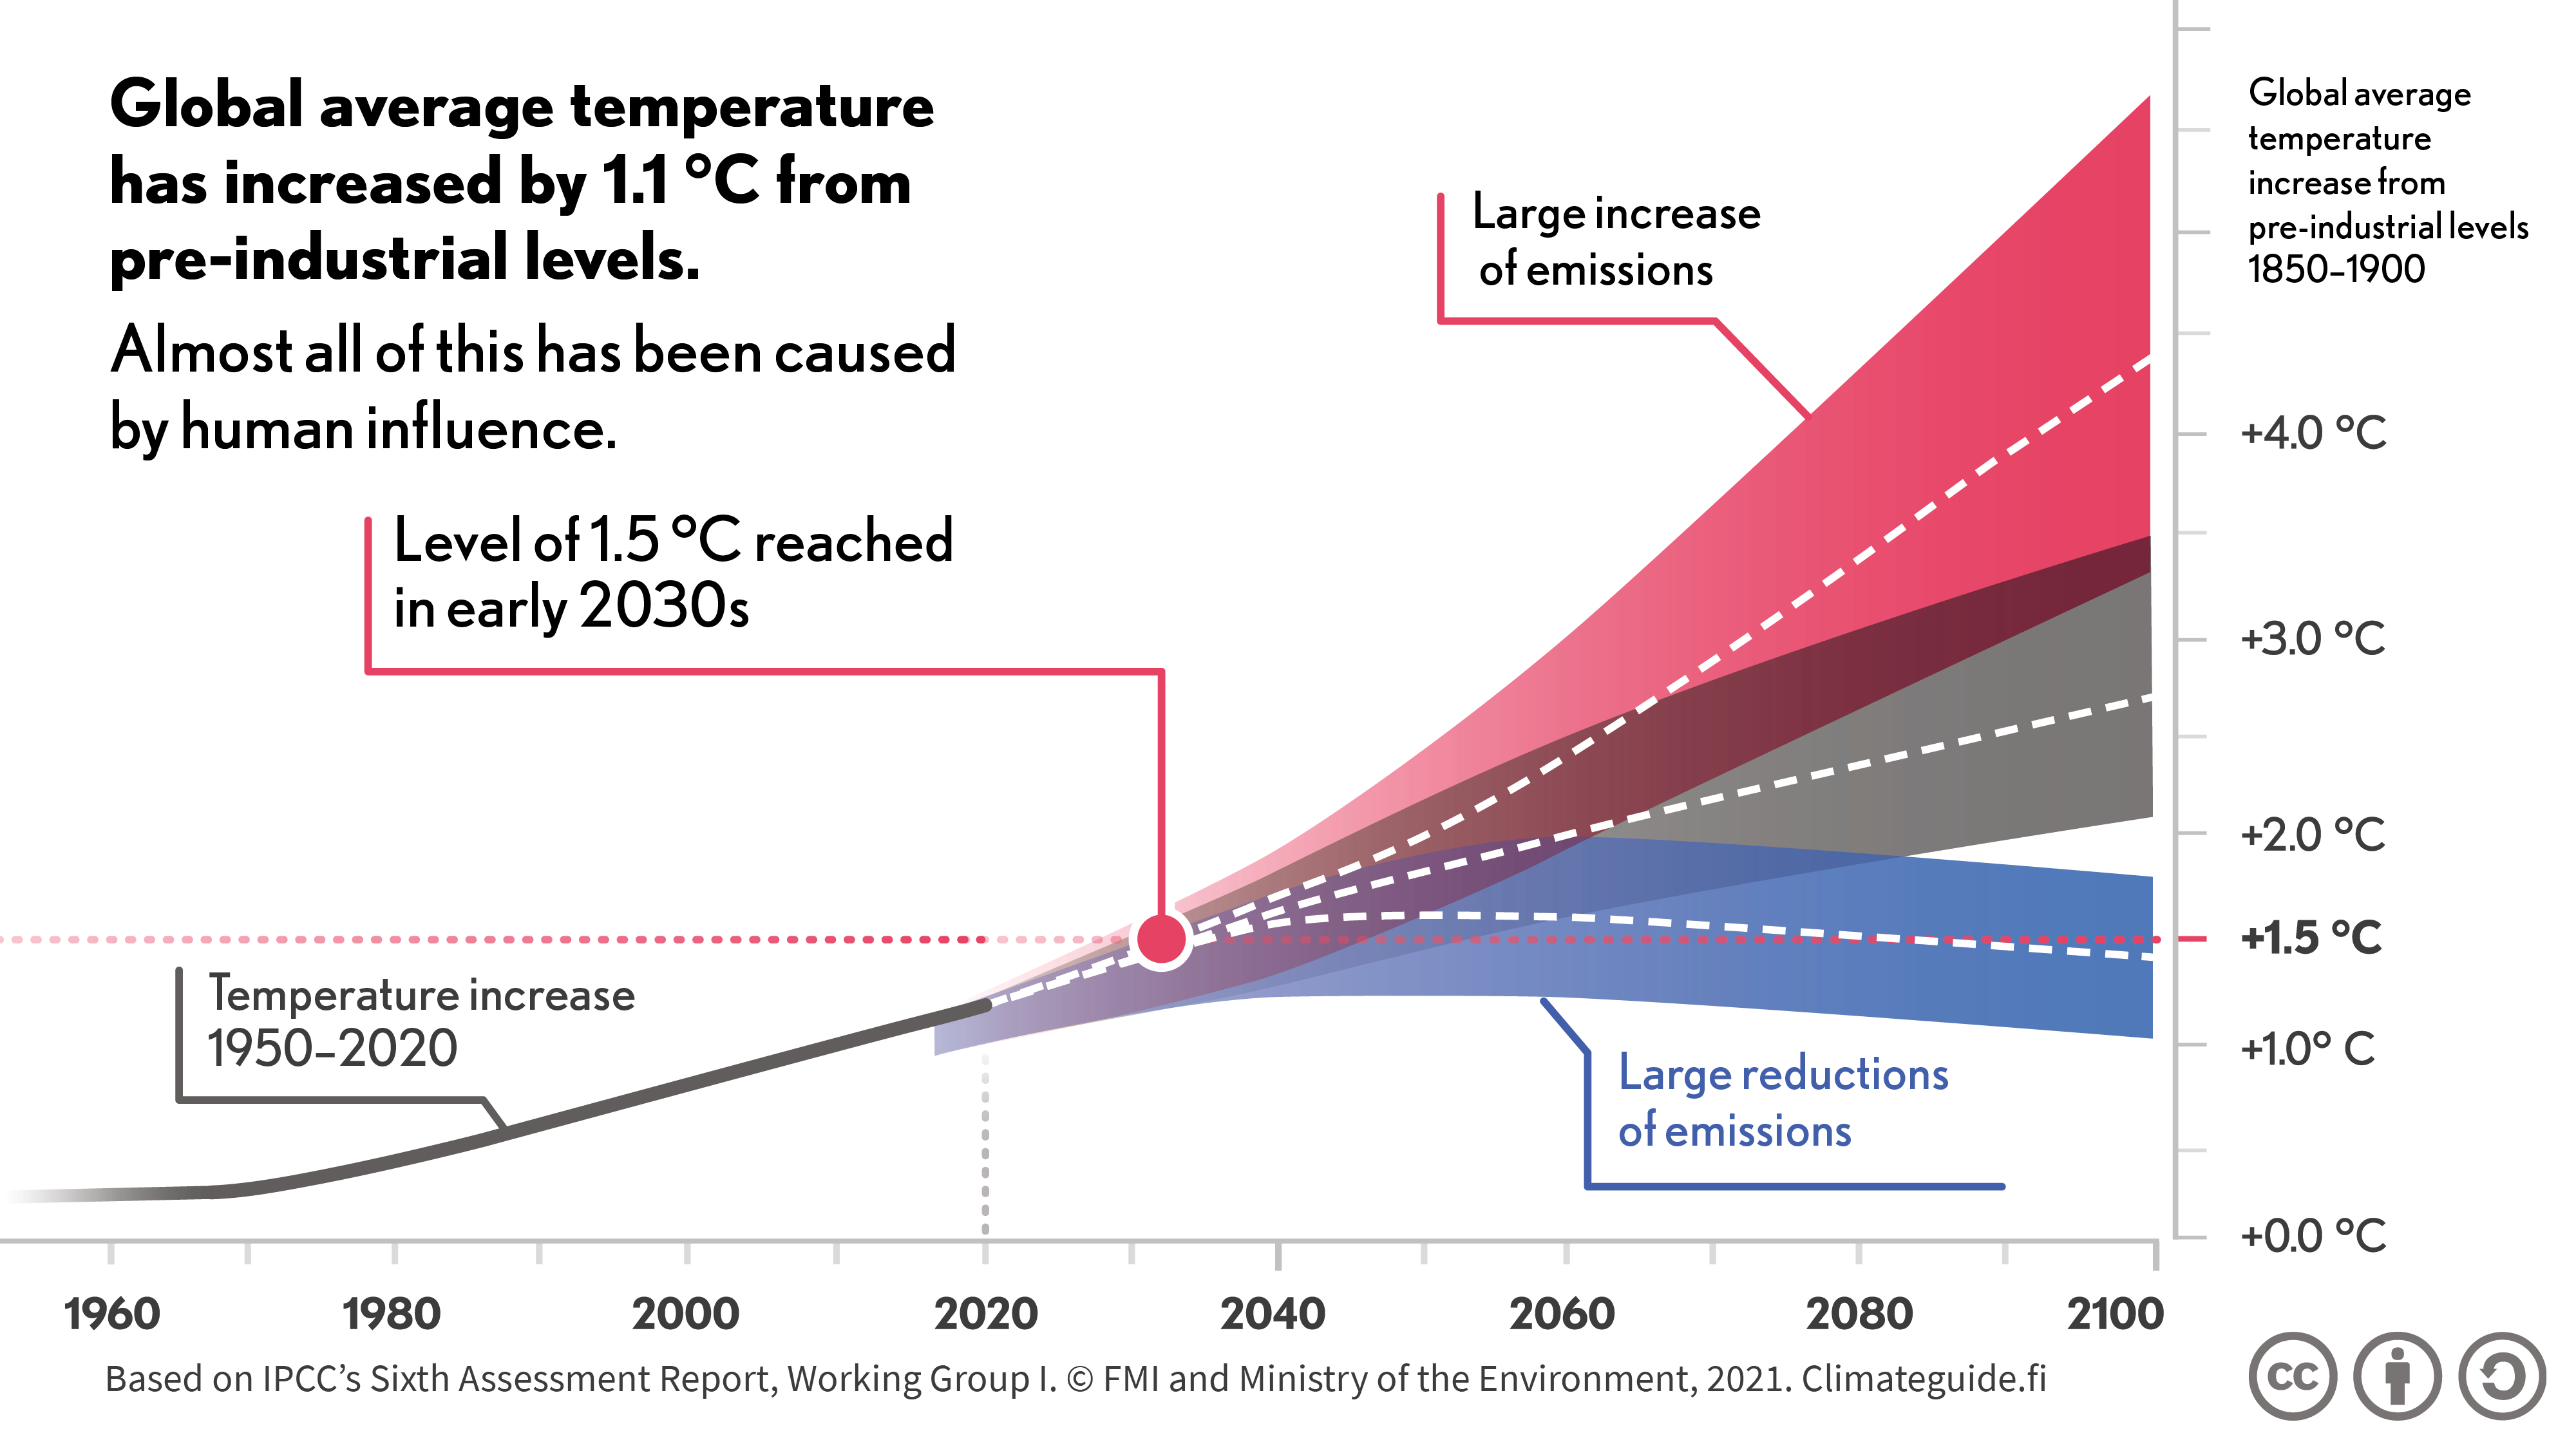
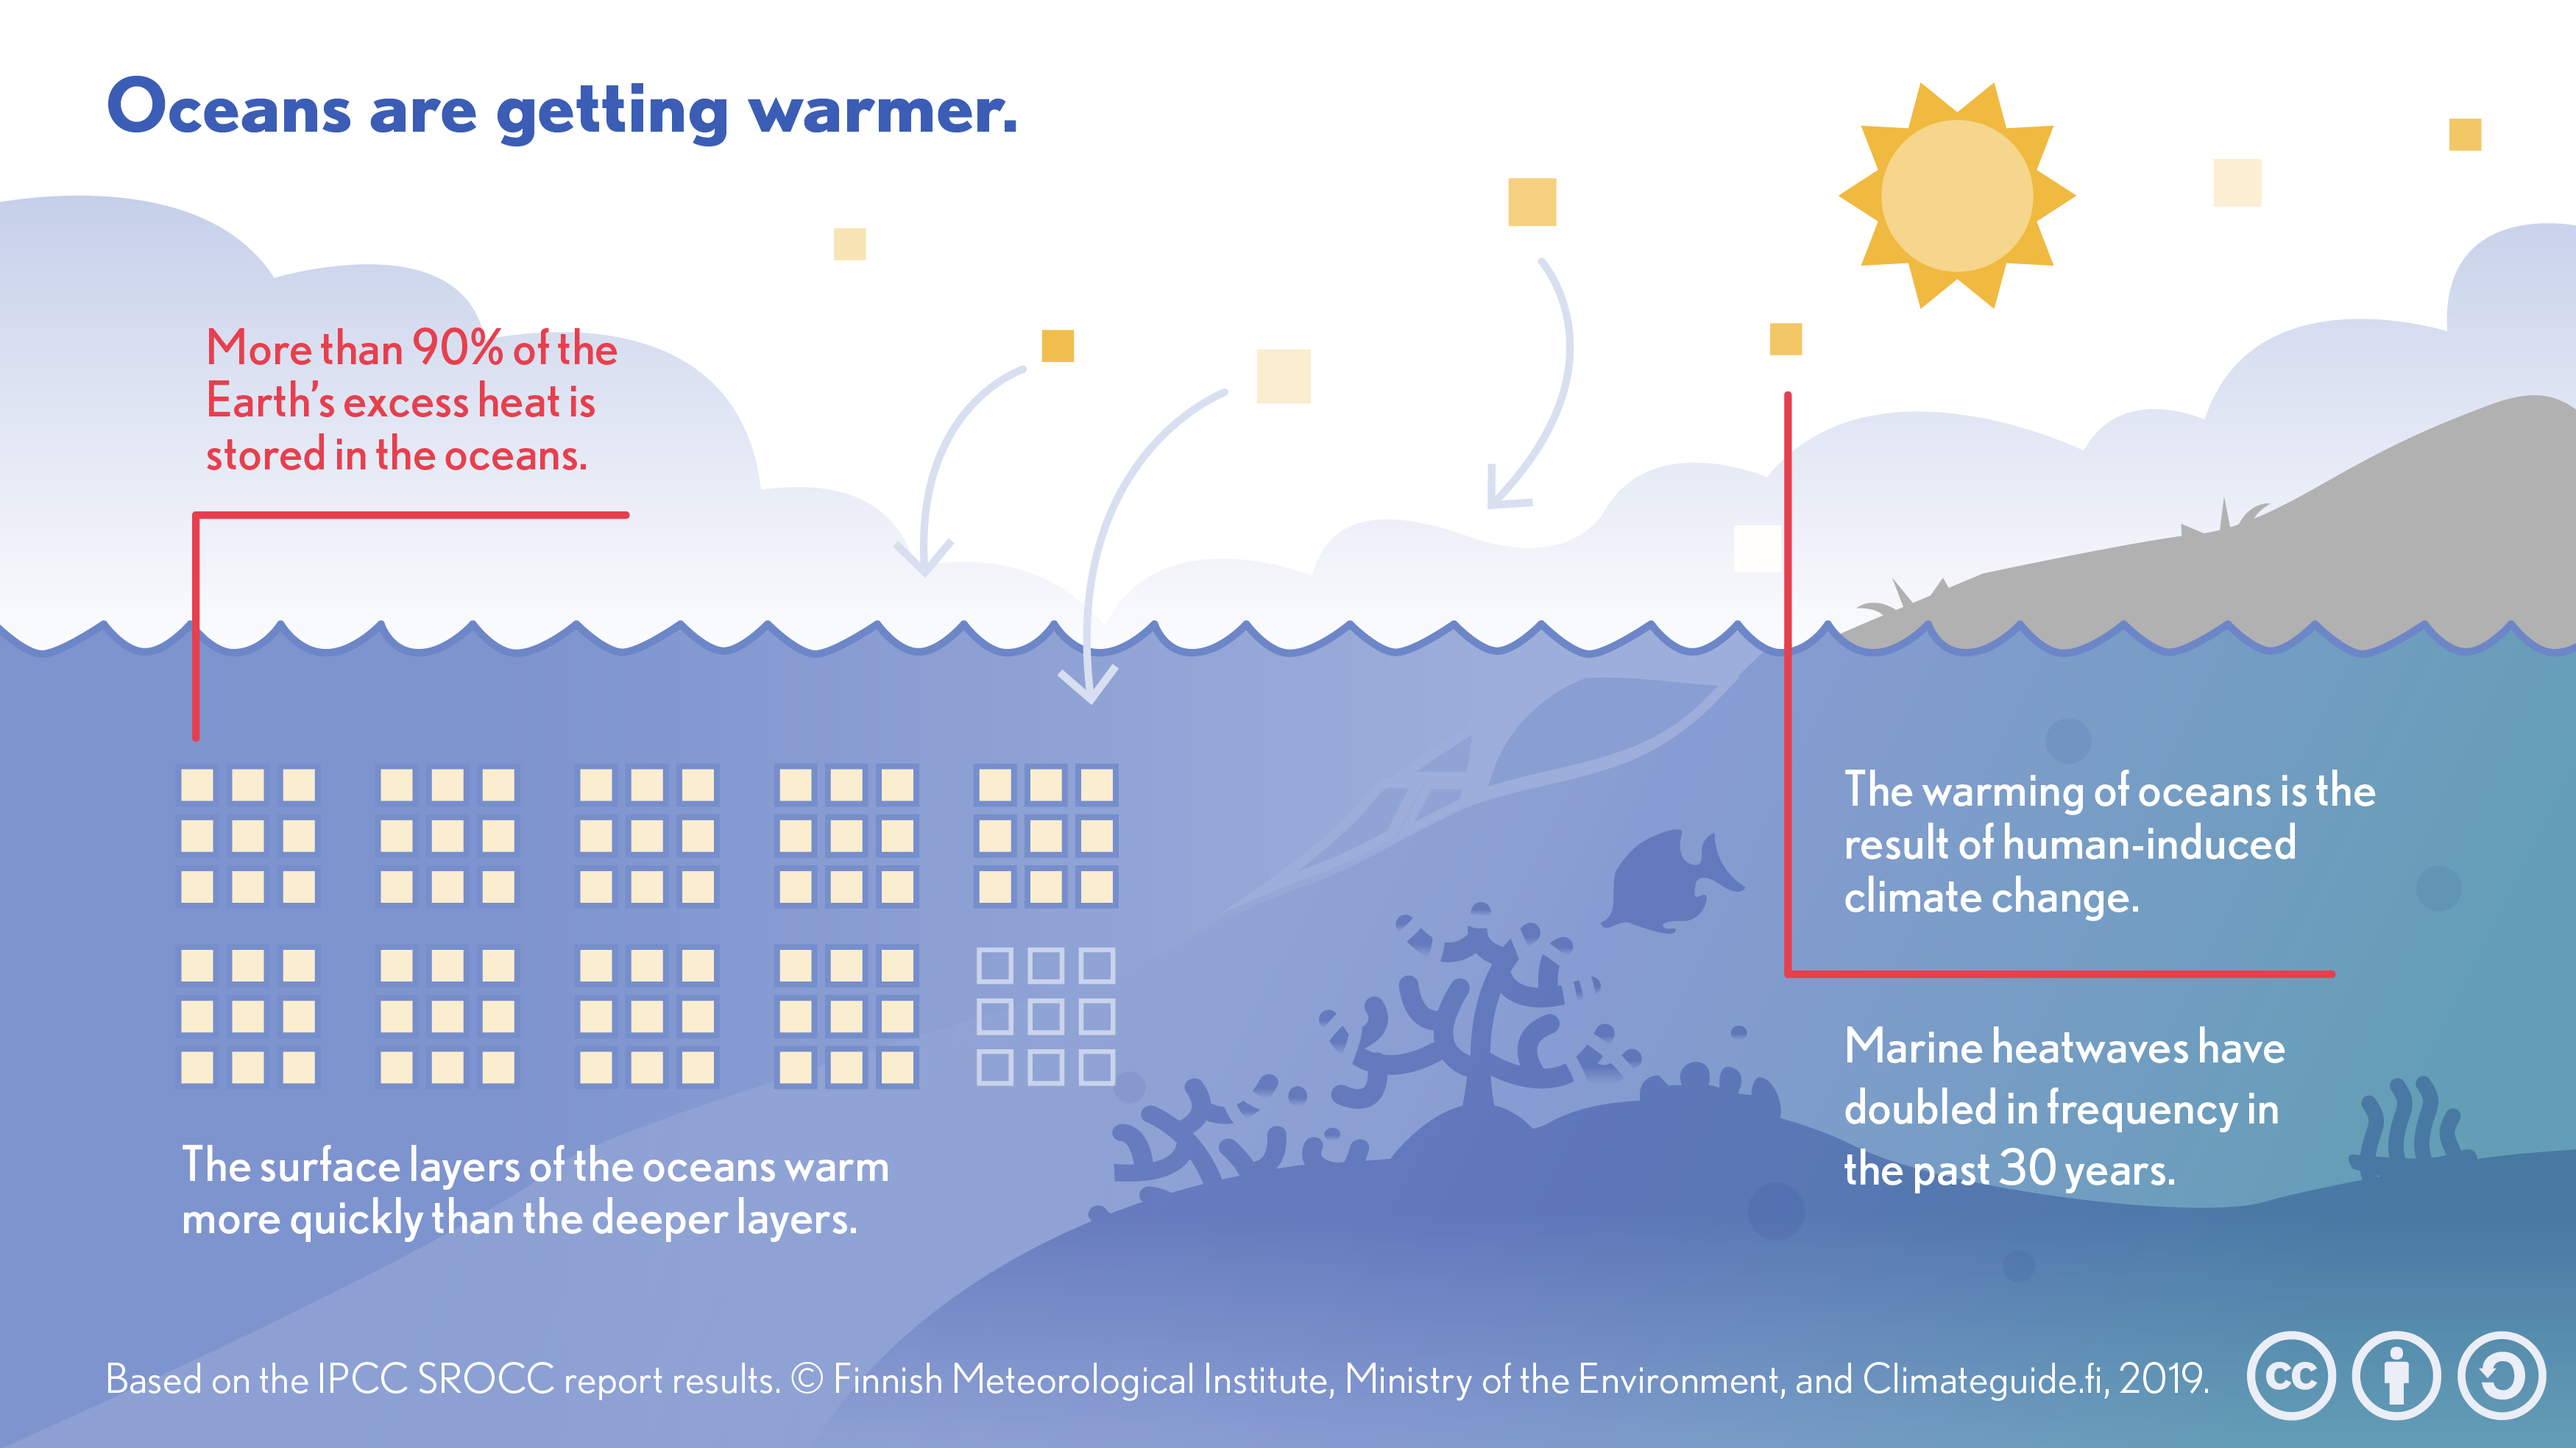
Selected graphics depicting the main findings of IPCC’s Special Report on Global Warming of 1.5°C, the Special Report on the Ocean and Cryosphere and the 6th Assessment Report.
Contributor: Tero Juuti (animator)
All graphics available at: https://www.ilmasto-opas.fi/etusivu